View HPC Resource Usage Charts
View charts that provide information about the core usage, job counts by state, and node usage at an HPC.
-
Click the Monitor tab.
Two charts are displayed:
- Core Usage Over Time by Job State
- Node Usage Over Time by Node State
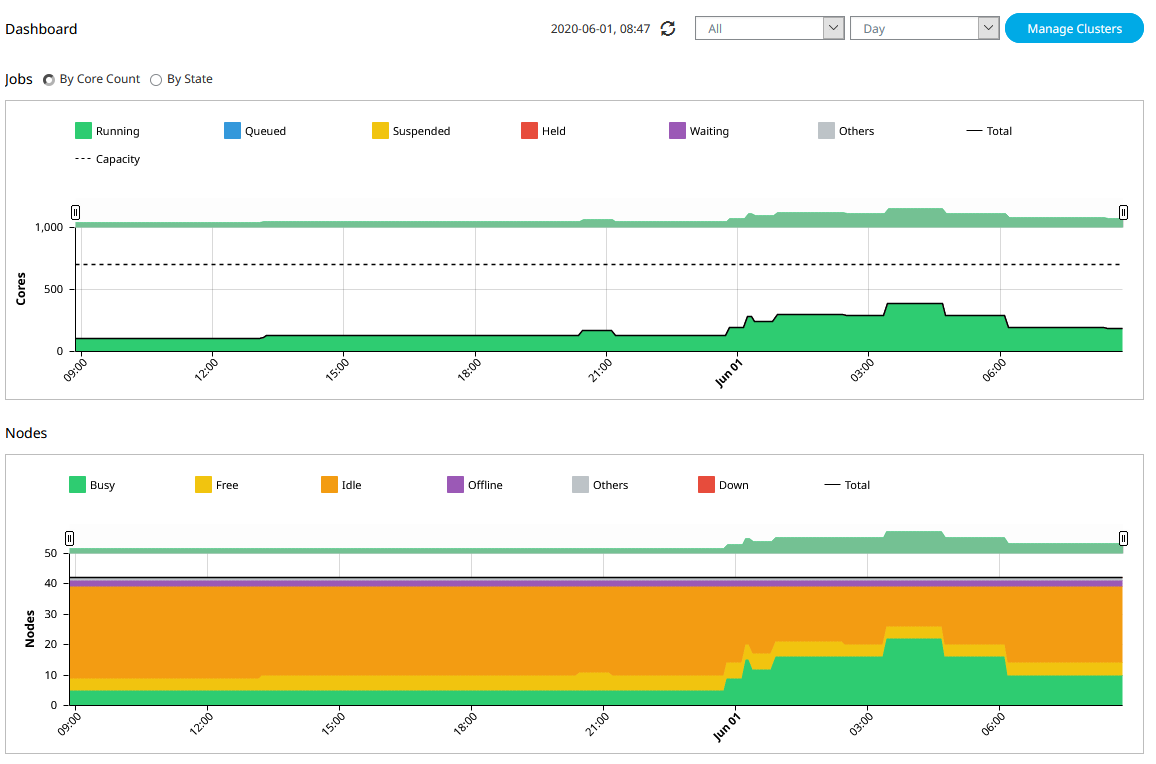
Figure 1. DashboardTip: By default, the data in the Dashboard charts is refreshed every 5 minutes. Refresh the data manually by clicking .
.
Figure 2. Refresh Data -
Enable By State to display the
Jobs Over Time by Job State chart.
The chart is displayed.
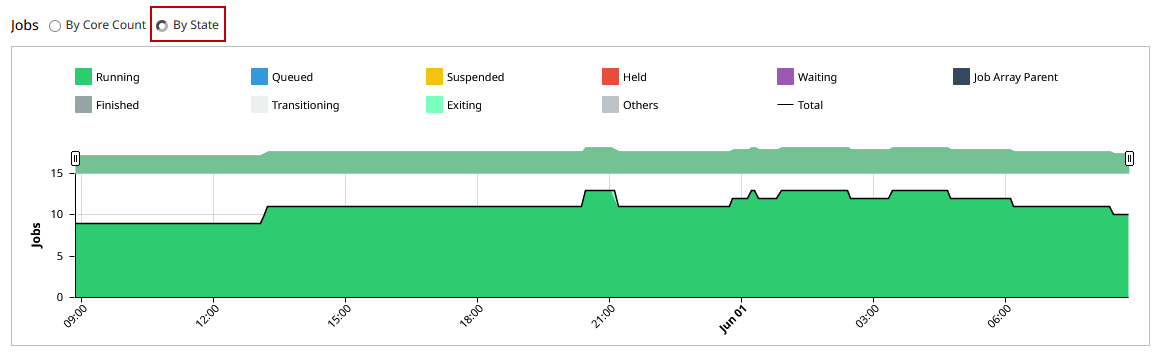
Figure 3. Jobs by State ChartTip: Enable By Core Count to revert the display back to the Core Usage Over Time by Job State chart.