Explore the Generated Shape
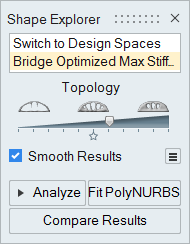
Once optimization results have been loaded, use the Shape Explorer to view the generated shape.
By default, the most recent optimization run is shown in the modeling window.
To view the result of a different optimization run, click on the appropriate item in the list at the top of the Shape Explorer.
- Use the list at the top of the Shape Explorer to quickly toggle between the design space and the optimized shape.
- To view a generated shape after exiting the Shape Explorer, select the design space, then select the run in the Alternative Explorer.
- To view a design space if the Shape Explorer is not active, right-click the shape and select Switch to Design Spacefrom the context menu.
- To delete a run from the Alternative Explorer, right-click the run name to select Delete Run.
Topology Slider
Use the slider on the Shape Explorer to analyze the quality of your topology or topography results.
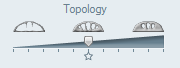
For topology optimization, if the optimized shape doesn't change much when you move the slider, this means you've arrived at a good solution and may even be able to make your design targets a bit more aggressive. If the topology changes significantly when you move the slider, you should consider relaxing your design targets and rerunning optimization until the topology remains consistent when the slider is moved.
The optimal result is the point on the slider at which all of the load and support locations are just connected. When your optimization objective is to maximize stiffness, the optimal shape is generally found near the center of the slider marked by the star. When your optimization objective is to minimize mass, the optimal shape is often found to the far right of the slider.
Topography Slider

For topography optimization, as you move the slider left and right the result shows what portions of your part need to be modified. Only two positions for the part are shown: the original position and the full bead height. The slider denotes the height above which beads will be moved to the full height. For example, if the full bead height is 4mm and there are areas that resulted in a height of 2mm, when the slider position is in the center those 2mm and higher areas will be shown at the full height of 4mm. Areas below 2mm of height will be shown at the original height. This makes the results easier to visualize and translate into CAD geometry.
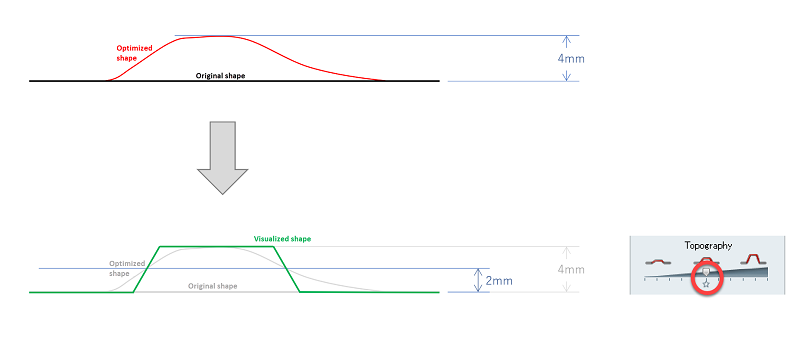
Figure 1. Topography Optimization: Visualized Shape
Part Gauge Legend
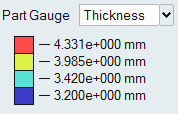
For gauge optimization, the Shape Explorer features a color-coded legend that displays the gauge thickness for each part. You can also change the legend to display the percentage change in gauge for each part using the pull-down menu.