This section explains briefly on how to build and generate reports for a model built in
the Truck Library.
For example, follow the steps in the Front end of truck section to build a Front suspension
model using the Assembly Wizard. At this point, you have built a complete front
suspension.
Features in the model
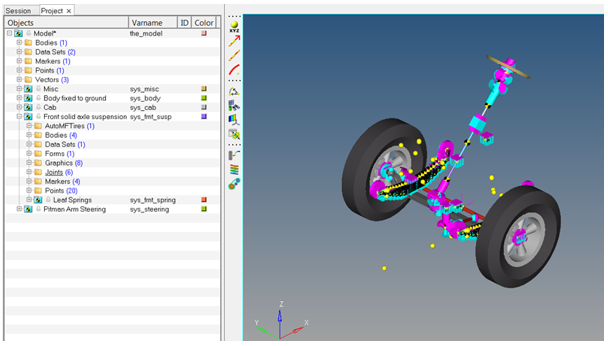
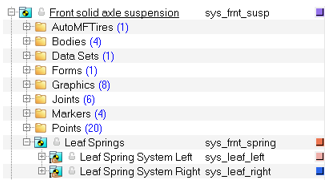
After building the model, the following model is displayed in the graphics area. Figure 1.
The model has the following features:
Front solid axle suspension has the Leaf springs as a subsystem. The strut, stabilizer
bar, and jounce and rebound systems are grouped under the suspension systems. Figure 2.
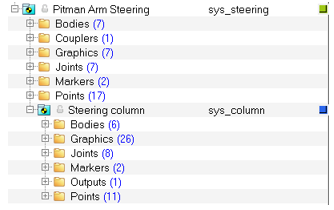
Pitman Arm Steering is a separate system with the steering column as a subsystem. Figure 3.
Individual systems can be turned on and off using the browser.
You can select any options in browser or in the graphical window to update their
properties.
Events
It is recommended that a simple event to be added, such as
Kinematics and Compliance Analysis, and then the model be simulated as soon as it is
built. Events create motions and forces in the model which make the system move. Most
events add additional parts to the model to perform the simulation. The following steps
outline how to add an event to the previously built model.
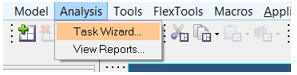
Click Analysis > Task Wizard, to begin adding an event to the model.
Figure 4.
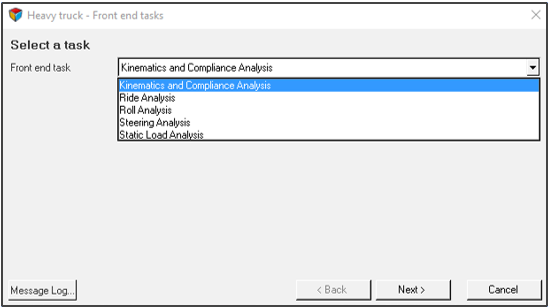
Select the required Front end task from the from the
drop-down menu.
Figure 5.
Note: To learn more about Ride Analysis, Roll Analysis, Steering Analysis, and
Static Load Analysis refer to the Front Suspension Analysis Tasks topic.
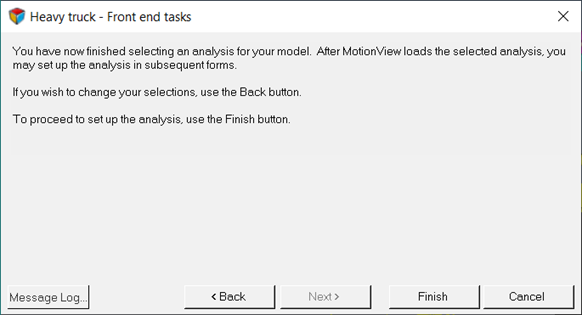
Select Finish to exit the Task Wizard.
Figure 6.
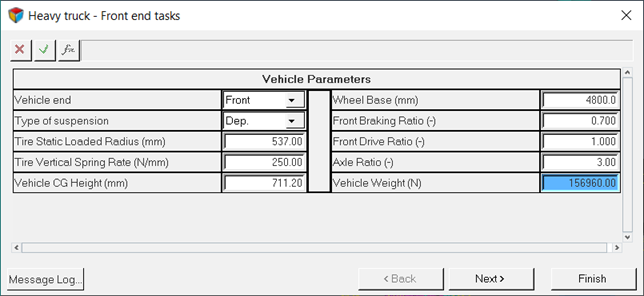
Add the required information in the Vehicle Parameters section.
Figure 7.
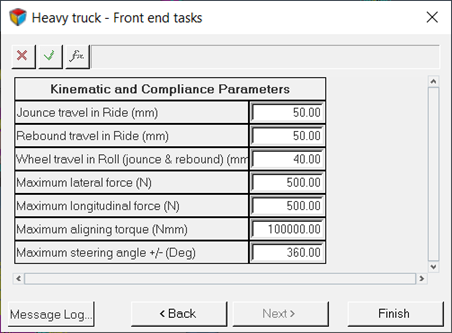
Add the distance that the suspension will travel during the event in jounce and
rebound and add the required information in the Kinematics and Compliance
Parameters section.
Figure 8.
The event is now ready to run.
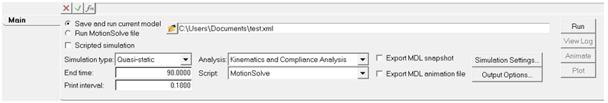
From the Model-Main toolbar, click the Run icon to open the Run Solver panel.
Figure 9.
Browse and locate the required file path to save and run the current
model.
Click the Run button (located on the far right side of
the panel).
MotionSolve is invoked in the background and
it displays several windows as it runs.
After MotionSolve is completed, close the windows
and return to the MotionView interface.
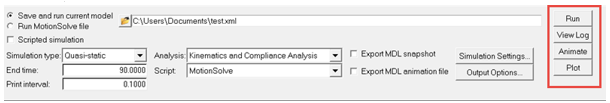
The Animate or Plot button now becomes enabled. You can plot results, look at
an animation, or examine tabular results.
Figure 10.
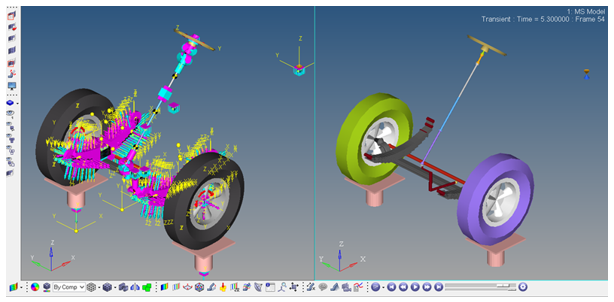
Click the Animate button (located on the far right side
of the panel) to create an animation of the simulation results.
Animation on the second window (on the right) is displayed. Figure 11.
Reports
A series of report templates are displayed. Report templates
are a series of pre-defined plots that plot the standard set of plots required for an
event. A report template generates all of the plots and properly label the plots. The
report template typically creates plots, an animation window, and a text window showing
the SDF’s. Reports are a powerful tool for generating engineering information and can be
easily customized.
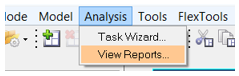
To view reports or examine tabular results:
Click Analysis > View Reports.
Figure 12.
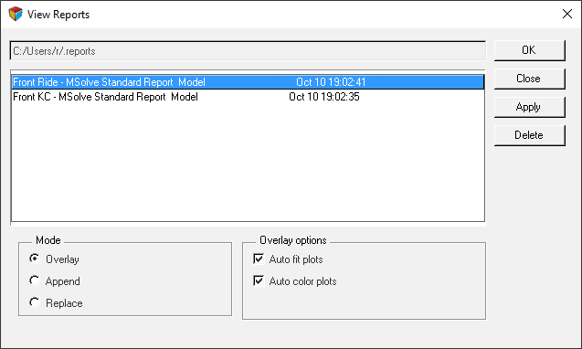
The View Reports Wizard opens.
Select the MSolve Standard Report Model option from the View
Reports window and click OK.
Figure 13.
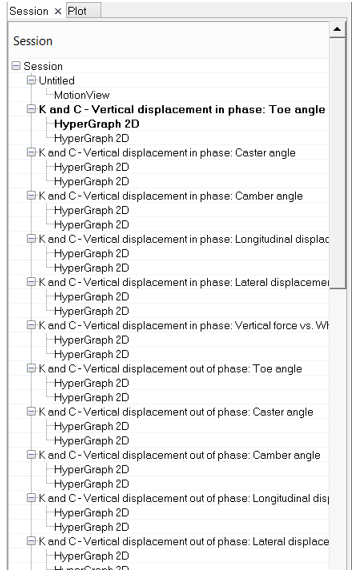
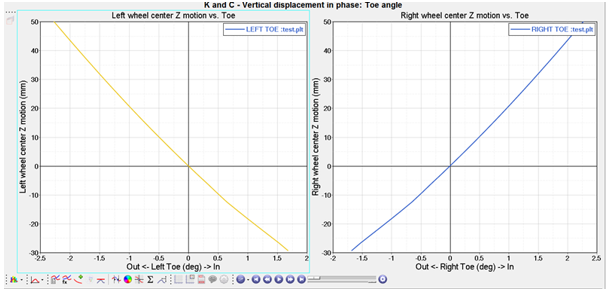
A series of pages with plots are displayed in the Session browser.
 to open the Run Solver panel.