Y Source
After making selections on the X Source tab, from the Y Source tab, select the Y type, request, and components to plot the data in HyperGraph.
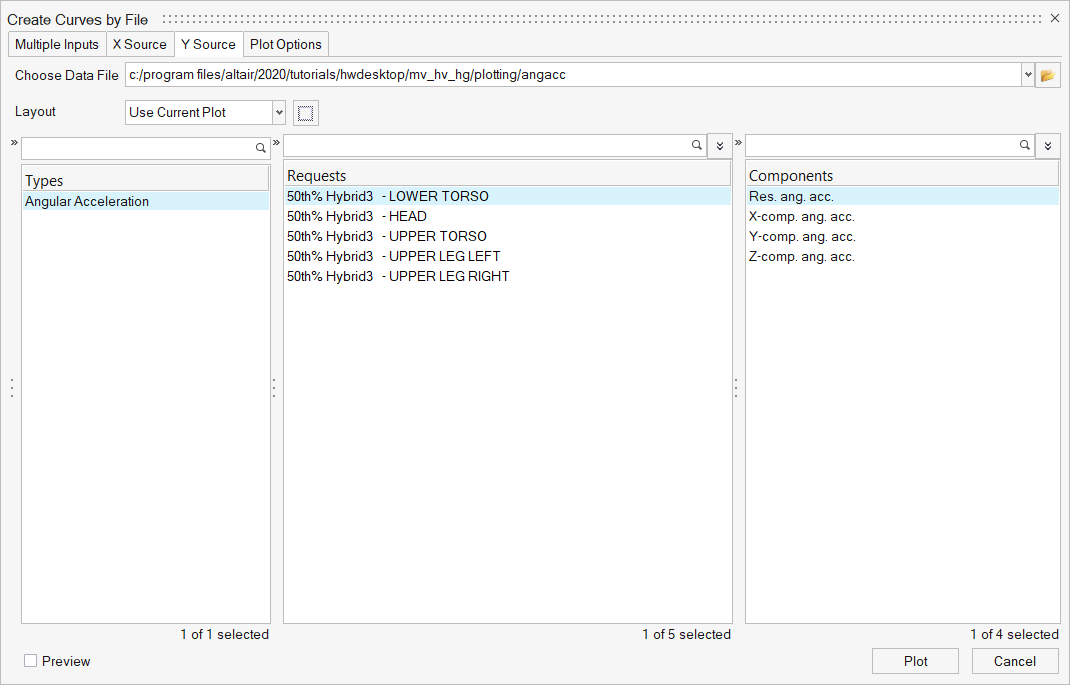
Figure 1.
- Choose Data Source
- Click the file browser button to load a data file. Y Source types are automatically populated based on the Multiple Inputs tab selections, if any. You can select multiple files through the file browser; the list will update with the selected files.
Layout
Use the Layout menu to specify how the plotted data is arranged on the page.
- Use Current Plot
- Every curve is overlaid in the active window.
When one of the following options is selected, the page layout icon becomes available.
- One Plot per Request
- Each selected request is plotted in a new plot with the
corresponding components overlaid.
For example, if two Y requests and four Y components are selected, two plots are created with four curves in each plot.
- One Plot per Component
- Each selected component is plotted in a new plot with the
corresponding requests overlaid.
For example, if two Y requests and four Y components are selected, four plots are created with two curves in each plot.
- One Curve per Plot
- Each curve is plotted in a new plot.
For all plotting options, a new page is created. The layout of the new page can be selected from the page layout button on Build Plots. When the plots are built, each window on the new page is filled. If more windows are required, another page of the same layout is created.
- One Plot per File
- Page Layout
- Choose the page layout based on the layout options selected.
Type, Request, and Component Selection
- Types Filter
- Enter the keyword to use as a filter when searching for types. Access the search string history from the drop-down menu.
- Types List
- Displays the types found (with or without a filter) from the file selected. Select a type to populate the Requests list.
- Requests Filter
- Enter a keyword to use as a filter when searching for requests. Access the search string history from the drop-down menu.
- Requests List
- Displays the requests found (with or without a filter) from the selected type. Select the requests to populate the Components list.
- Components Filter
- Enter the keyword that you want to use as a filter when searching for components. Access the search string history from the drop-down menu.
- Components List
- Displays the components found (with or without a filter) from the selected requests.
- Preview
- Quickly review curves before plotting them in the session. See Preview Curves for more information.
- Plot
- Plots the curve (s).