Move
Curve scaling, offsets, and axis assignments can be applied to multiple curves using the Move panel.
Figure 1.
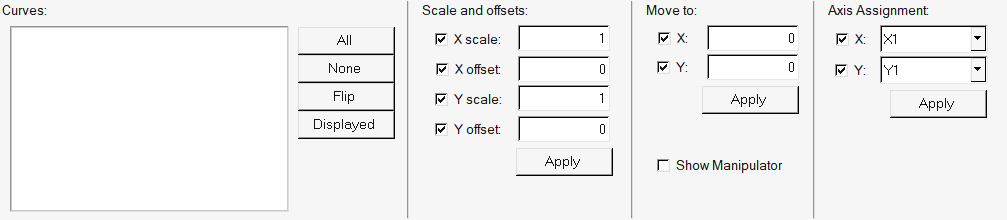
Figure 2.
- Curves
- The curves in the active window are displayed in the curve list. Curves must be either selected from the list or picked from the window in order to apply any scaling or offsets. Settings apply only to selected curves. Selected curves are highlighted in the list.
- Scales and Offsets
- When a data vector is scaled, the vector is multiplied by a specified
value. The original data values are not actually altered. Multiple
curves can be scaled simultaneously.
Offsetting a data vector shifts the data along the corresponding axis. Multiple curves can be offset at the same time.
You can enter math expressions, such as one for converting Fahrenheit to Celsius, in the scale and offset fields.
- Move to
- Moves the first point of the selected curve(s) to the specified XY coordinates.
- Show Manipulator
- Displays the manipulator in the graphical window. You can use the
manipulator to drag a curve to a different location in the plot, thereby
offsetting the curve. This option is off by default.
Click the manipulator with the left mouse button and drag the curve to its new location. The curve remains at the new location when the left mouse button is released. The X and Y offset values shown in the Plot browser Properties Table and the Scales, Offsets, and Axis Assignment panel (if active) are updated when the left mouse button is released and the curve is in its new location. The manipulator works even if the X or Y offset options are turned off.
- Manipulator Visibility
-
If you select another panel from the toolbar, the manipulator is not visible. It's only visible when the Scales, Offsets, and Axis Assignment panel is selected.
When the manipulator is visible, the following are true:
It is displayed at the point of the curve closest to the middle of the plot. It can be moved to other points on a curve by clicking on other curve values.
It will update when the offset values are modified by the user in the Scales, Offsets, and Axis Assignment panel and/or browser.
You can use the middle mouse button to zoom in on a curve. The manipulator remains visible while zooming, as long as the curve is visible.Note: You cannot drag the manipulator to a position outside the plot window. If the mouse pointer is moved to a location outside of the plot window, the manipulator snaps back and is displayed at the location where it left the plot window once the left mouse button is released.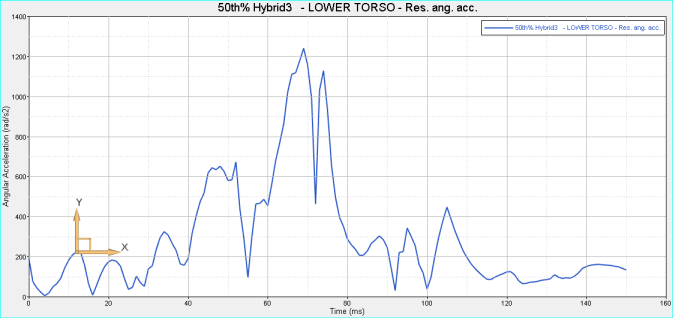
Figure 3. - Axis Assignments
- X and Y axes are assigned by selecting an axis from the corresponding axis list.