Notes
Annotate plots using notes.
Notes are text boxes placed in the HyperGraph window for labeling points, describing trends, and relating additional curve information.
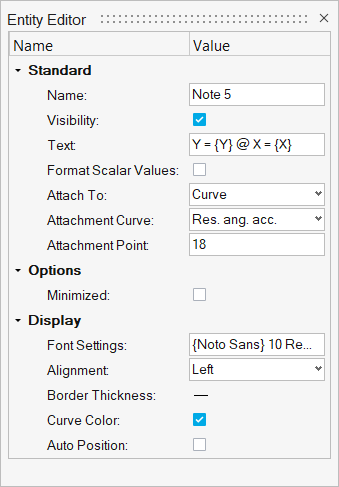
Figure 1. Entity Editor - Notes
Entity Editor Options
From the Entity Editor, update the note's properties.
Standard
- Name
- The name of the note.
- Visibility
- Displays the note in the plot window. Deactivate to hide the note.
- Text
- The note text or Templex expression in the note.
- Format Scalar Values
- Select this option to format scalar values in a note using the Fixed or Scientific format. The format type can be selected from the Format drop-down menu.
- Format
- Select Scientific or Fixed Format from the drop-down menu.
- Precision
- Both fixed decimal format and scientific notation display numbers to the right of the decimal point. The accuracy of each format can be adjusted by entering a value in the Precision text field.
- Attach To
- Select where the note will be attached. Options include Window, View, Curve, and Coordinates.
- Note Placement
- Select an option to position your note in a specific location within the
modeling window. The note retains its
position when zooming in and out. Options include:
- default
- Left-Top corner
- Left-Bottom corner
- Right-Top corner
- Right-Bottom corner
- User defined. Use the X Coordinate and Y Coordinate fields to enter specific coordinates for the note's placement in the modeling window.
- Options
- See Mouse Over Notes for more information on the features in the Options section.
Display
- Font Settings
- Click in this field to display the Font Selector dialog. From there, you can change the font type, style, and size.
- Alignment
- Text can be left aligned, right aligned, or centered in a note box by selecting the corresponding drop-down menu item. Text alignment is updated automatically.
- Border Thickness
- Determines the line thickness of the note's border. Select one of four line thickness styles from the drop-down menu to change the border.
- Curve Color
- This option is displayed when a note is attached to a curve.
- Border Color
- Click the color palette to edit the note's border color.
- Auto Position
- Auto Position Strategy
- See Note Positioning for more information on this feature.
Templex Statements in Notes
Notes can contain Templex statements as well as math and string functions and operators. Notes can be complete Templex templates. Templex enables you to include text from an external file, call external functions, assign variables, and perform math operations within a note.
From the Notes micro dialog, click Select Macro to select a Templex variable that can be included in a note. For example, if a note contains the variables {X}, {Y}, and {Slope}, the X and Y values, as well as the slope of the curve at the attachment point, are displayed in the note. As the note’s attachment point changes, the Templex variables update automatically.
- X
- Displays the X value of the attachment point.
- Y
- Displays the Y value of the attachment point.
- Time
- Displays the time value of the attachment point.
- Slope
- Displays the slope (first derivative) of the curve at the attachment point.
- Curv
- Displays the curvature (second derivative) of the curve at the attachment point.
Other Templex variables that can be included in a note are:
- {x.note}
- {y.note}
- {t.note}
- These can be applied if you are reading a curve from an external file, such as an ABF file or an external reader. Within the external file, there can be a particular request to which a note is assigned, or a note may be included to improve the understanding of the curve numbers, for example. The note is preserved in and accessed from the x, y, or t data vector when reading the curve from the external file.
- {x.filename}
- {y.filename}
- {t.filename}
- Displays the filename from which the data vector was derived. If the data vector is a math vector, no filename is displayed in the note.
- {index}
- Displays the index of the curve at the attachment point.
- {p1.title}
- If a note is attached to a curve, use this Templex expression to access the the page title.
- {p1w1.plotheader}
- If a note is attached to a curve, use this Templex expression to access the window's header.
Vector data can be referenced in a note calculation using either of the following statements:
- c#.vector
- Where:
- c@.vector
- Where:
- {p1.title}
- If a note is attached to a curve, use this Templex expression to access the current page's title.
Attach To
The Attach To tab allows you to specify how a note is displayed in the window.
Notes can be anchored one of four ways, which are described below. Once attached, notes can be positioned anywhere in the window. When a curve is either cut or copied, notes attached to the curve are also cut or copied. Notes can also be attached to curves using the Templex statements, attach_note_at and attach_note_to.
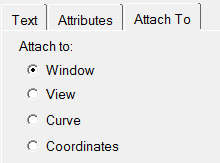
Figure 2.
- Window
- The note remains stationary when the plot is repositioned in the window.
- View
- The note moves with the plot when the plot is repositioned in the window.
- Curve
- A leader connects the note to a specific point on the curve and the note moves with the plot when the plot is repositioned in the window. This is not available for bar charts.
- Coordinates
- A leader connects the note to a specific point on the plot. This is not available for bar charts.