Add a Note
Add a note to a point on a curve.
-
From the Line Chart, Bar Chart, or Complex Chart ribbon, click the
Notes tool.
 Figure 1.
 -
Select the note's border, right-click and select Edit to
display the Entity Editor. Use this to edit the note's
properties.
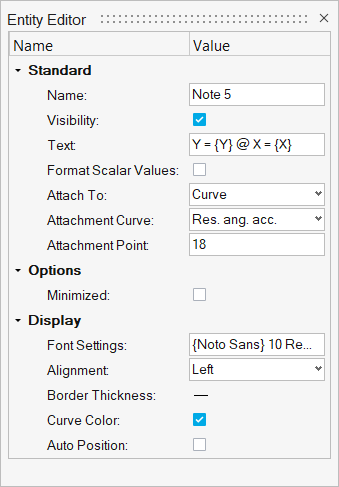 Figure 2. Entity Editor - NotesTip: You can also use the Plot Browser to edit the note. Click on the note from the plot window to display its attributes in the Plot Browser.Tip: See Notes for more information on editing the note attributes.