Values
Retrieve individual point data on any curve in the active window.
When a point on a curve is selected, the point data is displayed on the panel. Using the Coordinate Info panel you can retrieve data from three curve types: 3D line, surface, and waterfall. The panel options change depending on the curve in the active window.
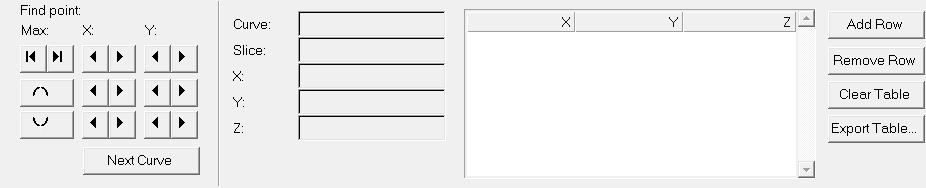
Figure 1.
- Pick a point from a curve.
- Locate a point using the Find point controls.
- Select a point from the point list.
Find Point Controls
Locate a point on a curve using the Find point controls.
Cross hairs indicate the currently selected data point. Information about the point is displayed on the panel.
When using 3-D line curves, the application centers the row in the table containing the X, Y, and Z values.
- Click:
- To find:
 or
or 
- Left-most or right-most end point.
 or
or 
- Next point to the left or right.

- Global maximum of the curve.
- or
- Next local maximum to the left or right.

- Global minimum of the curve.
- or
- Next local minimum to the left or right.
- Next Curve
- Corresponding point on the next curve.
Point Data
Select a point on a surface or waterfall curve to view its data.
If you click a point on a surface or waterfall curve, the Add Row, Remove Row, and Clear Table buttons are enabled if currently disabled. Conversely, if you pick a point on a line curve, the Add Row, Remove Row, and Clear Table buttons are disabled if currently enabled.
- Surface Line, and Waterfall Curves
- Curve
- The name of the curve.
- X, Y, Z
- The X, Y, or Z value of the data point, respectively.
- Slice
- The name of the waterfall slice at the selected point (for waterfall curves only).
Point List
The point list displays the XYZ data points for the selected curve.
Use the scroll bars to view the entire list. When you select a row from the point list, the row is highlighted, the point data is displayed in the fields to the left of the table, and cross-hairs are displayed at the row's XYZ values.
- Add Row
- A row is added to the table and the cross hairs are moved to the next set of XYZ values in the table.
- Remove Row
- The row is removed from the table and the cross hairs are moved to the next set of XYZ values in the table.
- Clear Table
- All rows in the table are removed. One row is created with 0, 0, 0 for the XYZ columns.
- Export Table
- Allows you to export the data in the table to a .csv file.
Build a List of Coordinate Locations for Waterfall and Surface Plots
Display Point Data by Picking a Point on a Curve
Or
Display Point Data by Using the Point List
-
From the HyperGraph 3D toolbar, click the
Coordinate Info button,
 .
.
Display Point Data Using the Find Point Controls
-
From the HyperGraph 3D toolbar, click the
Coordinate Info button, .