Create Curves by File
Loads Flux motor efficiency files in text format.
The HyperGraph 3D file viewer plots Flux motor efficiency map files. CSV files with column data are also supported.
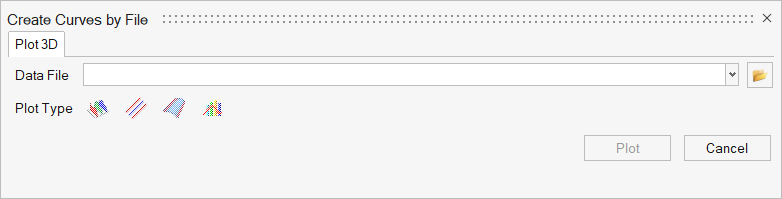
Figure 1.
Open an Existing Model
- Use to display the Create Curves by File dialog. Select plot
data information and click Plot to plot the
curve(s)..
The Create Curves by File dialog is displayed.
- In the Data File field, click the file browser button to navigate to your
working directory and select a file to open.
The current file is cleared from the memory, and the file you selected opens.
- After the file loads, the Plot Type icons become active. Choose from waterfall, line, surface, and bar chart.
- Click Plot to plot the selected 3D plot type.