3D Chart Context Sensitive Menu
From the HyperGraph 3D3D Chart modeling window, right-click to display the context menu.
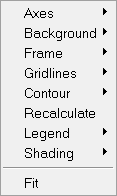
Figure 1. 3D Chart Context Menu
- Axes
- Choose from the following options from the Axes submenu:
- Box
- Displays the Box grid style. This is the default.
- Lines
- Displays the Line grid style. If you select Lines, and right-click on the axis again, a different context menu is displayed. This menu displays options also found on the Axes panel.
-
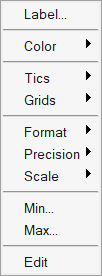
Figure 2. -
Figure 3. -
Figure 4. - Chart
- Displays the chart grid style.
- Cubical
- The displayed length of each axis is the same.
- Unscaled
- The displayed length of each axis is based on the axes values.
- Best Fit
- Adjusts the length of the axes to maximize the graphics area.
- Locked
- Locks the lengths of the axes so that they are not rescaled.
- Background
- Select a color for the background of the 3D plot. Select Custom to customize the color.
- Frame
- Select a color for the area surrounding the 3D plot. Select Custom to customize the color.
- Gridlines
- Select a color for the gridlines of the 3D plot. Select Custom to customize the color.
- Contour
- Choose from the following options on the Contour submenu. On and
Discrete are the defaults.
- On/Off
- Turn the contour on or off.
- Discrete/Blended
- Select Discrete or Blended for the contour.
- Recalculate
- Forces the plot to regenerate all calculated data and reread all file data.
- Legend
- You can turn the legend on or off. On is the default.
- Shading
- Choose from the following options on the Shading submenu:
- Smooth
- The edges are smooth. This is the default.
- Flat
- The edges are flat.
- Fit
- Zooms in or out to fit the curve's maximum and minimum values to the axes.