Annotations Toolbar
The Annotations toolbar provides you quick access to the Measures panel, Notes panel, Tracing panel, Image Plane tab, and the Build Plots panel.
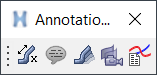
Figure 1.
To access the each panel or tab, click the corresponding button on the toolbar:
| Button | Panel/Tab | Description |
|---|---|---|
| Opens the Measure panel. | Measure the relative distance between nodes, the angle between nodes, or entity results. You can create curves from a selected measure into preview a plot, a new plot, or an existing plot. | |
| Opens the Notes panel. | Notes can be added to animation files to annotate the image using the Note panel. | |
| Opens the Tracing panel. | Entities can be traced during animation. When an object is traced, a series of transparent images of the object are left behind at certain intervals along the path of motion. | |
| Opens the Image Planes tab. | Select and overlay images (such as company logos, watermarks, etc.) or videos in the graphics area for correlation and presentation purposes. | |
| Opens the Build Plots panel. | Construct multiple curves and plots from a single result file. |
Note: There is no right-click behavior for the icons listed above.