Reference Curve
When you select Reference from the Properties Table, HyperGraph sets the curve as the reference curve.
When a curve is set as a reference curve, the following are true:
- The curve (and shading, if areas are shaded) move behind the grid lines of the plot, so that the grid lines are visible over the curve/shading.
- Autofit does not apply to the curve.
Below is an example of a curve with the Reference property turned on (“Zero Y” shading). See Curve Shading for more information.
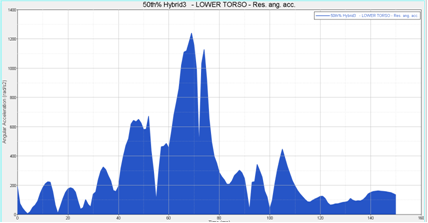
Figure 1.
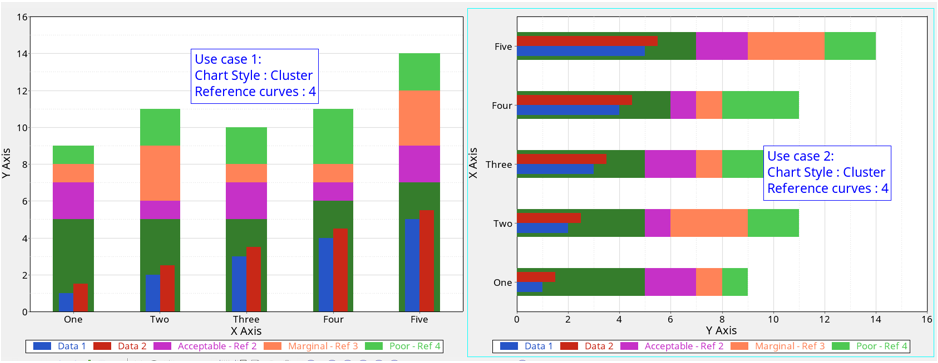
Figure 2.