HyperGraph 3D
HyperGraph 3D offers a 3-D plotting environment that is fully integrated with HyperWorks, for managing, reviewing, and analyzing 3-D plots such as waterfall, surface, and 3-D line data.
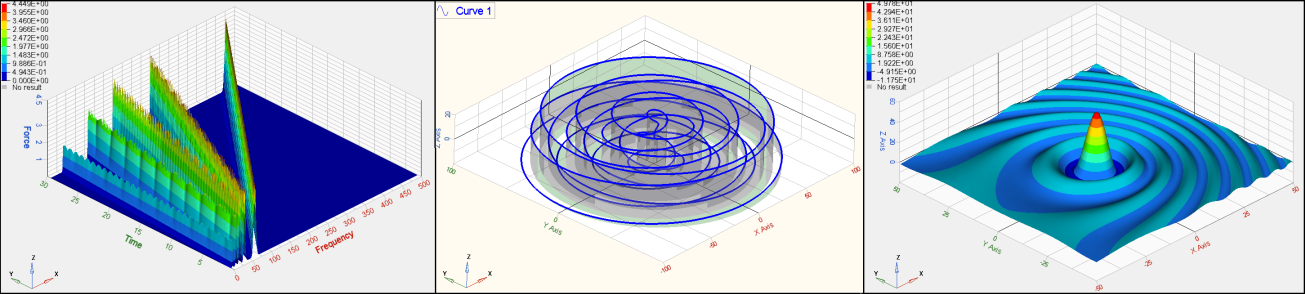
Figure 1.
Functionality is easily accessible right under the mouse, from user-defined menus, and via standard Windows user interfaces. Any analysis session, including sessions integrated with other HyperWorks applications, can be run as an automation process over and over again for processing new sets of data. The 3-D graphics window is fully dynamic, supporting rotations, panning, and zooms without changing aspect ratios or losing axis labels.
HyperWorks provides a rich tool set for querying 3-D plots. Both planar and surface sections can be passed through 3-D data to generate section cut plots. Other query tools are as easy to use as clicking on the data to view X, Y, Z values.
HyperWorks also supplies features for building and analyzing waterfall data including order calculations, visualization, and plotting orders in XY plots. In addition, HyperWorks contains readers for a variety of 3-D data formats and can generate 3-D plots from mathematical expressions using an extensive math library.
Benefits
- Waterfall plots support magnitude versus frequencies or orders versus time or magnitude.
- Calculate orders by scaling, DFT, or resampling the response data.
- Zooming in on data retains display of axis values.
- Pages of 3-D plots existing in a single session can be dependent on a single XY curve. Updating the XY curve automatically propagates the change through all 3-D curves.
- The user interface is consistent with typical windows applications as well as withHyperGraph 2D and HyperView.
- Include high quality image captures of 3-D Plots in reports and presentations.
- Lies on an open architecture driven by a Tcl command layer. Additional math functions, file readers, dialogs, pull down menus, and right-click menus can be easily added.