Plot Browser Context Sensitive Menu
From the Plot Browser, right-click on a highlighted entity to access the following context sensitive menu options.
Page Context Menu
- Expand All
- Expands all pages in the session, exposing all items nested within the folder.
- Collapse All
- Collapses all pages in the session.
- Select All
- Selects all page titles in the session.Note: When in Toggle Sync Mode,
 , the Select All option is
unavailable.
, the Select All option is
unavailable.
Plot Window Context Menu
- Expand All
- Expands all plot windows in the session, exposing all items nested within the window.
- Collapse All
- Collapses all plot windows in the session.
- Select All
- Selects all plot windows in the session.
- Select All in Page
- Selects all plot windows on the page.
- Paste
- Pastes a copied window.
- Autofit Curves
- Applies Auto Fit to the curves in the selected plot window.
Note: When in Toggle Sync Mode, , the Select All and Select All in Page options are
unavailable.
Single and Multiple Curve Math Menus
- Select All
- Selects all curves in the session.
- Select All in Page
- Selects all curves on the page.
- Select All in Window
- Selects all curves in the window.
- Isolate
- Isolate displays only the selected curve(s), turning their display state to on, and turning all other curves off. You can isolate per window, across pages, or across the session.
- Isolate Only
- Similar to Isolate, except that it also affects curves other than the selected curve. This turns off ALL displayable curves except for those selected. This action can be applied per window, across pages, or across the session.
- Reverse Isolate
- Reverse Isolate hides the selected curve and displays only the non-selected curves. This action can be applied per window, across pages, or across the session.
- Reverse Isolate Only
- When more than one curve is selected, Reverse Isolate hides the selected curves and displays only the non-selected curves. This action can be applied per window, across pages, or across the session.
- Turn On
- Displays a curve in the graphics window.
- Turn Off
- Hides a curve in the graphics window.
- Cut
- Removes the curve from the Plot Browser and deletes it from the current session.
- Copy
- Copies the selected curve. To paste it into the browser, select the window name from the browser, right-click and select Paste.
- Delete
- Deletes the curve from the session.
- Extreme Curve
- After plotting curves, right-click in the Plot Browser and select Extreme Curves from the
context-sensitive menu.
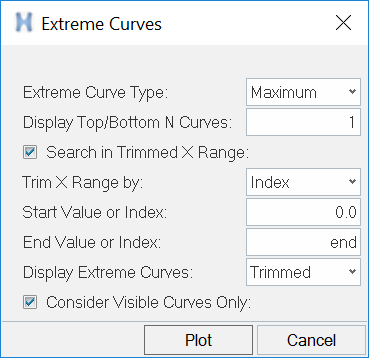
Figure 1. Extreme Curves - Curve Correlation
- Outputs a correlation metric in the form of notes on the plot using correlation algorithms. These functions are used to calculate a correlation metric between test and CAE data. Sprague-Geers Combined Metric (SGCM) and Weighted Integrated Factor (WIFac) are supported.
-
- Sprague-Geers
- The Sprague-Geers metric is a simple integral comparison
metric that includes both magnitude and phase errors, which
are calculated independently and then combined to give a
comprehensive error. The error calculation can be biased
towards either the measured time history (test) or the
computed (CAE) time history, with the former being the most
common.
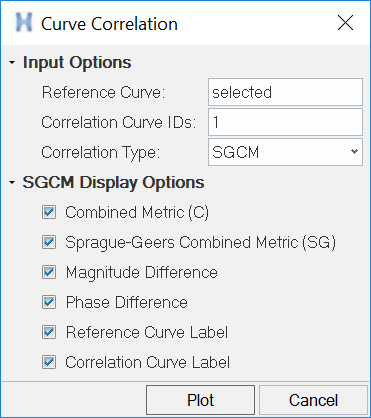
Figure 2. Curve Correlation - SGCM - Weighted Integrated Factor
- The Weighted Integrated Factor method (WIFac) is used in the
auto industry for crash simulations. This metric is
associative and calculates the agreement between two
signals. This is advantageous in situations where the
experimental data is known to have significant error. WIFac
is weighted by the absolute maximum of the function values.
This weighting has the effect of scaling local differences
to increase the effect of errors at high magnitude function
values.
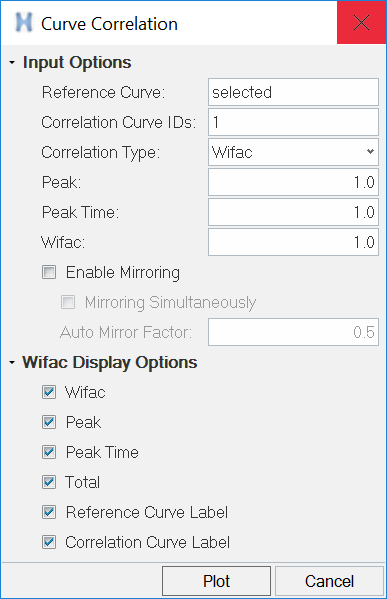
Figure 3. Curve Correlation - WIFac
- From the Curve Correlation dialog, you can leave the default settings or
edit the options as needed. Click Plot to display
notes with the correlation metrics in the plot window.
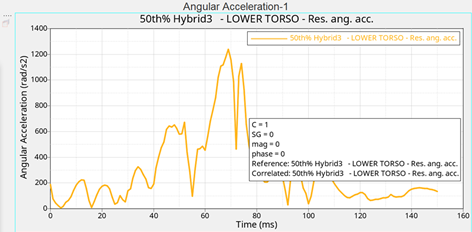
Figure 4. Curve Correlation - Notes - Add Stackmath Operation
- Create a math stack on a curve. From the dialog, use the filter bar,
 , to filter the math functions to apply to a
curve. Once a math operation is applied to a curve, the curve is redrawn
per the math function without creating any duplicate curves. The
Name/Value entity editor in the dialog displays the parameters for the
math function, which you can edit as needed. The parameters displayed
are based on the selected math function.
, to filter the math functions to apply to a
curve. Once a math operation is applied to a curve, the curve is redrawn
per the math function without creating any duplicate curves. The
Name/Value entity editor in the dialog displays the parameters for the
math function, which you can edit as needed. The parameters displayed
are based on the selected math function.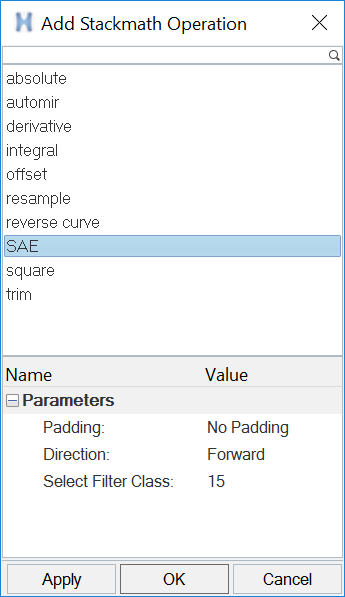
Figure 5. Add Stackmath Operation - Single Curve Math
- Performs a math functions on a single curve, which results in the creation of a new curve.
- Multiple Curve Math
- Performs math functions on multiple curves, which results in the creation of a new curve. The name of the math function is also included in the name of a new curve. For example, c7:Resultant.
If you have the Vehicle Safety Tools loaded, the Filter and Injury menu options are
also included on the context sensitive menu. Please see the Vehicle Safety Tools topic for more
information.
Note: When in Toggle Sync Mode, , the Select All and Select All in Page options are
unavailable.
Vector Context Menu
- Select All
- Selects all vectors displayed in the tree.
- Select All in Page
- Selects all vectors displayed on the page.
- Select All in Window
- Selects all vectors displayed in the window.
Note: When in Toggle Sync Mode, , this menu is disabled.
You can also add your own options to the context sensitive menu using the *BrowserContextMenuItem() preference file command.