CORA and ISO-18571
Use the HyperGraph 2D Curve Correlation dialog to find correlation metrics in the form of notes using different correlation algorithms. The CORA and ISO-18571 functions calculate the correlation metric between test and CAE data.
- CORA
- The Correlation Analysis (CORA) calculates correlation metric between CAE and Test Data signals in the form of time history. Includes both corridor and cross correlation, which are calculated independently and then combined to give a comprehensive error. The error calculation can be biased towards either the measured time history(Test) or the computed (CAE) time history, with the former being most common.
- CORA(CORRIDOR)
- The Corridor metod (CR) calculates correlation between two signals by means of corridor fitting. The error calculation can be biased towards either the measured time history (Test) or the computed (CAE) time history, with the former being most common.
- CORA(CROSS CORRELATION)
- The cross correlation metod (CRCR) calculates correlation between two signals by calculating phase shift, size and progression. The weighted some of these three values gives total cross correlation rating.
- ISO-18571
- The ISO metric combines different types of algorithms to get reliable and robust assessment between CAE and Test Data signals in the form of time history. Includes corridor, phase, magnitude, and slope which are calculated independently and then combined to give an overall ISO rating. The error calculation can be biased towards either the measured time history (Test) or the computed (CAE) time history, with the former being most common.
Open the Curve Correlation Dialog
- From the file menu, click to open the Create Curves by File dialog.
- From the Open File dialog, navigate to your working directory and select a file to open and plot some curves.
- From the Plot Browser, select a reference curve, right-mouse click, and select Curve Correlation.
- From the Correlation Type drop-down menu, select a correlation method.
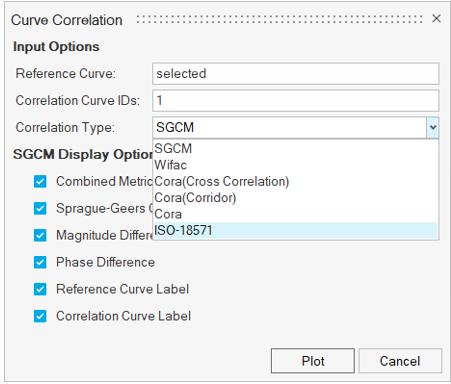
Figure 1. - Select Cora to display the following options.
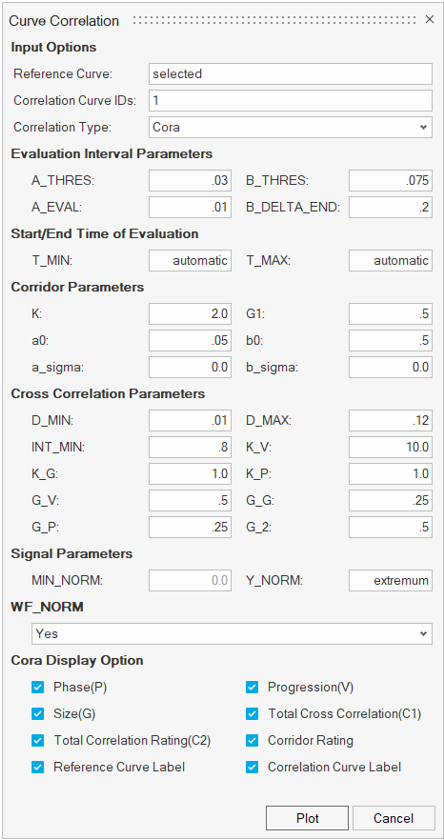
Figure 2. - Retain the default settings or change the defaults per your requirements and
click Plot.
Notes are displayed with the correlation metrics in the plot window.
Input Options
- Reference Curve
- Select reference curves through the Plot Browser or enter a list of ID’s. For example, 1-4.
- Correlation Curve IDs
- An individual ID or list of IDs. For example, 5-7.
- Correlation Type
- Supported methods include:
- SGCM
- Wifac
- Cora(cross correlation)
- Cora(Corridor)
- Cora
- ISO-18571
Cora Parameters
- Evaluation Interval Parameters
- Description
- A_THRES
- Threshold to set the start of the interval of evaluation. Varies between 0 and 1.
- B_THRES
- Threshold to set the end of the interval of evaluation. Varies between 0 and 1.
- A_EVAL
- Automatically calculated interval of evaluation. Varies between 0 and 1.
- B_DELTA_ENDis
- Shortens the end of the interval of evaluation if it is calculated automatically. Varies between 0 and 1.
- Tmin/ Tmax
- Defines the starting and the ending time of the evaluation interval.
- Corridor Parameters
- Description
- K
- Exponent factor (progression) for the calculation of the corridor rating.
- G-1
- Weighting factor of the corridor rating.
- a0
- Width of the inner and outer corridor.
- b0
- Width of the outer and outer corridor.
- a_sigma
- Factors of the standard deviation to widen the inner corridor.
- b_sigma
- Factors of the standard deviation to widen the outer corridor.
- Cross Correlation Parameters
- Description
- D_MIN
- Calculates the interval of evaluation. Varies between 0 and 1.
- D_MAX
- Calculates the interval of evaluation. Varies between 0 and 1.
- INT_MIN
- Minimum overlap of the interval. Varies between 0 and 1.
- K_V
- Exponent factor (progression) of the calculation of the progression rating, V.
- K_G
- Exponent factor (progression) of the calculation of the size rating, G.
- K_P
- Exponent factor (progression) of the calculation of the phase shift rating, P.
- G_V
- Weighting factors of the progression rating.
- G_G
- Weighting factors of the size rating.
- G_P
- Weighting factors of the phase shift rating.
- G_2
- Weighting factors of the cross-correlation method.
- Signal Parameters
- Description
- MIN_NORM
- The limit to start special treatment of secondary axis. Varies between 0 and 1.
- Y_NORM
- Type of calculation of Y_NORM; options include extremum or value.
- WF_NORM
- Normalization of the weighting factors; options include YES or NO.
Select ISO-18571 to display the following options:
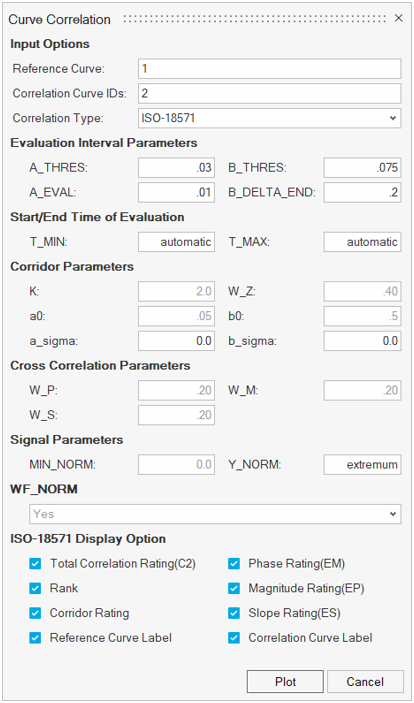
Figure 3.
ISO-18571 Parameters
- Evaluation Interval Parameters
- A_THRES
- Threshold to set the start of the interval of evaluation. Varies between 0 and 1.
- B_THRES
- Threshold to set the end of the interval of evaluation. Varies between 0 and 1.
- A_EVAL
- Automatically calculated interval of evaluation. Varies between 0 and 1.
- B_DELTA_END
- Shortens the end of the interval of evaluation if it is calculated automatically. Varies between 0 and 1.
- Tmin/ Tmax
- This keyword defines the starting and the ending time of the interval of evaluation.
- Corridor Parameters
- K
- Exponent factor (progression) for the calculation of the corridor rating.
- W_Z
- Weighting factor of the corridor rating.
- a0
- Width of the inner and outer corridor.
- b0
- Width of the outer and outer corridor.
- a_sigma
- Factors of the standard deviation to widen the inner corridor.
- b_sigma
- Factors of the standard deviation to widen the outer corridor.
- Cross correlation Parameters
- W_P
- Weighting factor of the phase score.
- W_M
- Weighting factor of the magnitude score.
- W_S
- Weighting factor of the slope curve.
- Signal Parameters
- MIN_NORM
- The limit to start special treatment of a secondary axis. Varies between 0 and 1.
- Y_NORM
- Type of calculation of Y_NORM; options include extremum or value.
- WF_NORM
- Normalization of the weighting factors; options include YES or NO.
Cora Display Options
- Phase(P)
- Display the phase value.
- Progression(V)
- Display the Progression value.
- Size(G)
- Display the Size value.
- Total Correlation Rating(C2)
- Display the Total Correlation Rating value.
- Total Cross Correlation Rating(C1)
- Display the Total Cross Correlation Rating value.
- Corridor Rating
- Display the Corridor Rating value.
- Reference Curve Label
- Display the Reference Curve label.
- Correlation Curve Label
- Display the Correlation Curve label.
ISO-18571 Display Options
- Total Correlation Rating(C2)
- Display the Total Correlation Rating value.
- Phase Rating(EM)
- Display the Phase Rating value.
- Rank
- Display the rank value.
- Magnitude Rating(EP)
- Display the Magnitude Rating value.
- Corridor Rating
- Display the Corridor Rating value.
- Slope Rating(ES)
- Display the Slope rating value.
- Reference Curve Label
- Display the Reference Curve label.
- Correlation Curve Label
- Display the Correlation Curve label.