Plot Browser Filter
The Plot Browser contains several ways to filter your plot data to display specific plot entities in the browser.
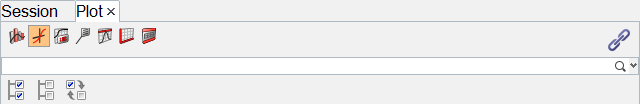
Figure 1.
Enter Search String Field
- Press the Enter key
- Click the magnifying glass.
- Use the Add as Filter option in the properties table.
If you enter an invalid search string, a red x is displayed in front of your entry:
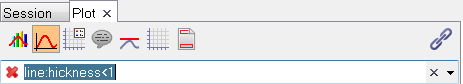
Figure 2.
Clear Search String Field
- Clicking on the "x" on the right side of the search string field.
- If the magnifying class is displayed, click on it and it changes into the "x", then click on the "x" to clear the field.
- Highlighting the search string and press Delete or Backspace on your keyboard.
Clearing the search string field displays the full browser tree.
Filter Syntax
All property keywords, like the ones used below, can be easily inserted into the search string field via the Add as Filter or Add as unevaluated Filter context menu in the Property Table. Using this feature also allows for the correct usage of double quotes and the escape sequences in the filter syntax.
Filter for a property
<keyword>:<value>Filter for all curves with the color red:
linecolor:2Supported logical operators: AND, OR and NOT
linecolor:4 AND linethickness:1Parentheses can be used to build more complex filter strings
linecolor:4 AND (linethickness:1 OR linethickness:3)Filtering for labels with blanks requires double quotes
label:"LOWER TORSO - X-comp. acceleration"Filtering for labels that contain special characters, such as double quotes and parentheses, requires the escape sequence
label:/"{y.HWRequest} - {y.HWComponent}/"The wildcard "*" for any number of characters and "?" for exactly one character are supported
If no wildcard is added at the beginning or the end of the filter string, it will be used as if the wildcard "*" is added at both ends. If at one end a wildcard is added, the other end is treated like it is the beginning or end of the filter string.
label:"*TORSO*"label:"TORSO*"Using Add as Filter to Define Search Parameters
To apply a filter on a curve or on an x/y vector property, right-click on the curve or x/y vector’s property in the Properties Table and select Add as filter, as shown below.
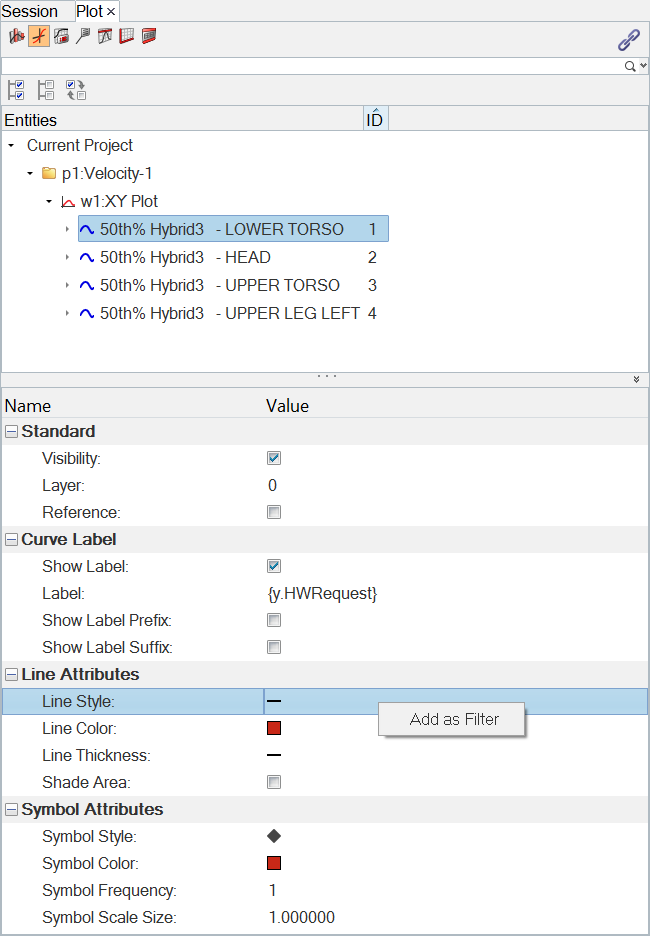
Figure 3.
The filter is added to the search field at the top of the browser. If you add more than one filter type, it will be added to the search field, with the word AND, as shown below. In this example, Line Thickness and Line Color were both added as filters.
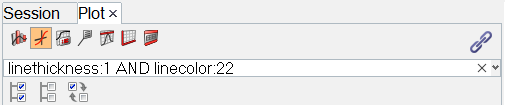
Figure 4.
If you want to change the line thickness or line color search criteria, you can backspace to remove the number from the search field and a context sensitive menu is displayed containing the line thickness types or color palette. Selecting a new line thickness type or line color automatically adds the number equivalent to the search field.
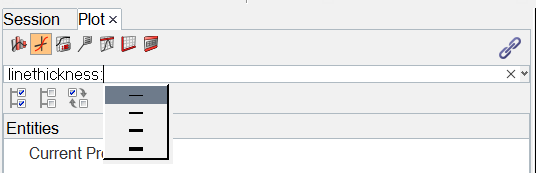
Figure 5.
All text fields which support Templex have an additional filter option, Add as unevaluated Filter. This allows you to add the unevaluated Templex code as a filter.
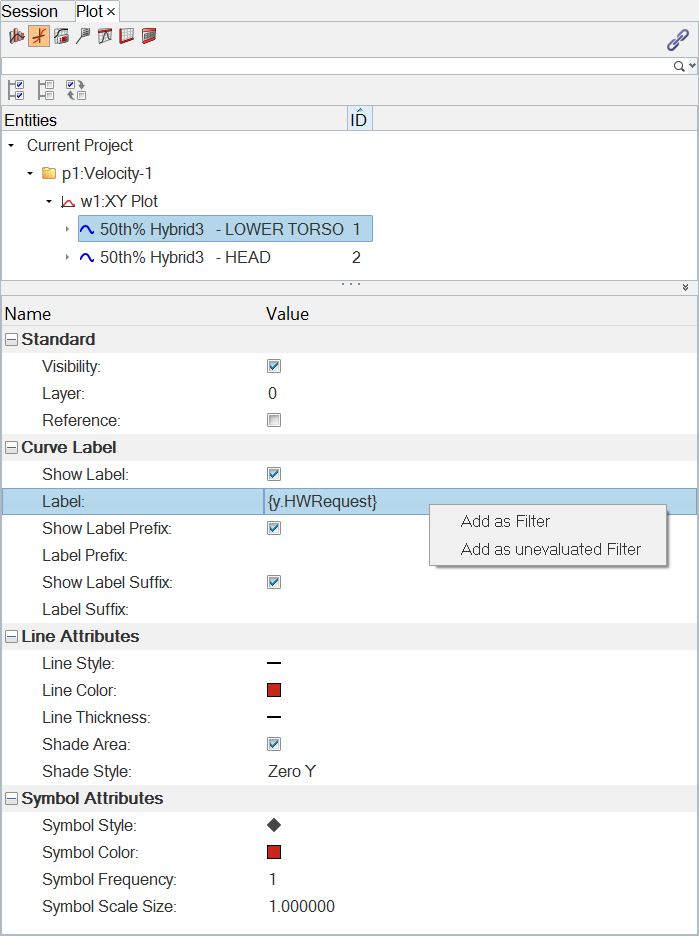
Figure 6.
Additional Permitted Search Criteria
- Window and entity properties
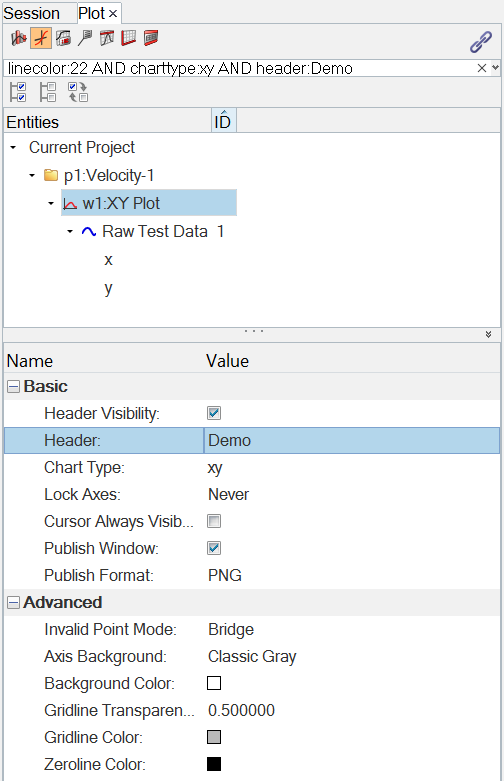
Figure 7. - Page and entity properties
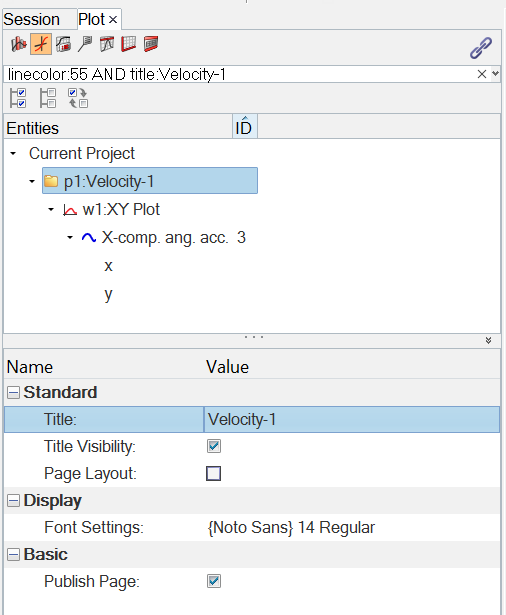
Figure 8.
Drag and Drop Support
On the Define Curves panel, you can use the Cut, Copy, and Paste buttons to add and remove curves to/from a window or remove them from the curve list. Limitations that are defined in the Define Curves panel apply to the cut and paste feature in the Plot Browser as well.
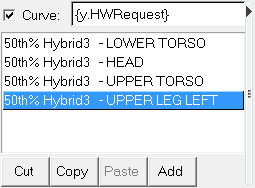
Figure 9. Define Curves panel Cut, Copy, and Paste
You can define the position where you want to paste the curve. In the image below, you can cut the curve surrounded with the red border and add it to the window 2 on page 2.
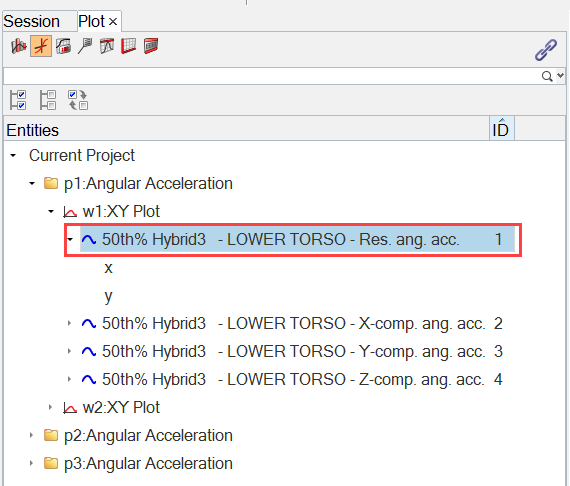
Figure 10.
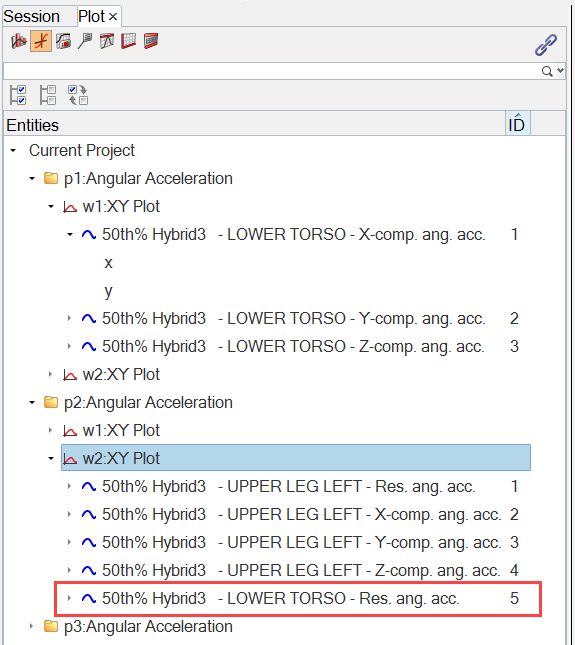
Figure 11.
Filter Example
The example below illustrates searching for all axes with Acceleration in the label on an xy plot.
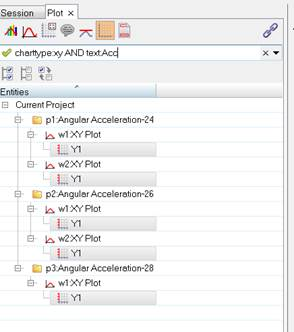
Figure 12.