Multiple Sample Analysis, Structures MSA - Load
Load a .tpl template file from a Structures MSA analysis.
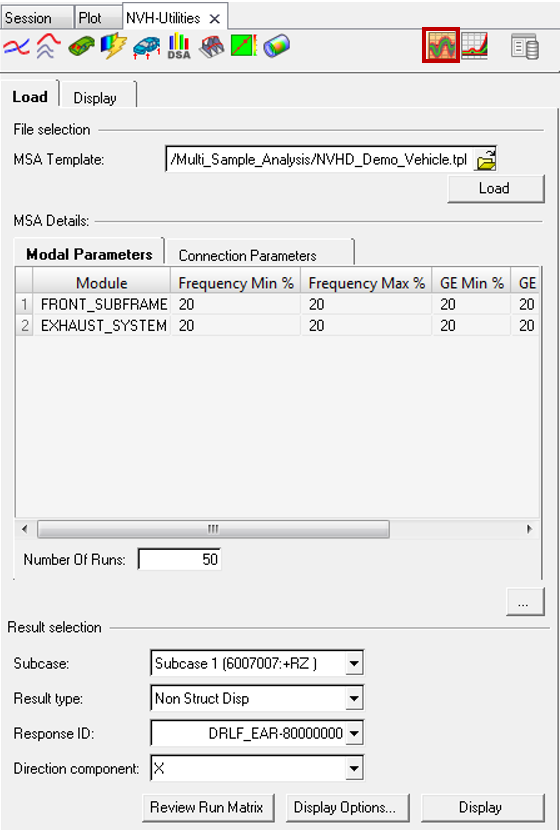
Figure 1. NVH-Utilities Browser - Load tab (Structures MSA)
You can also load a *.tpl file from .
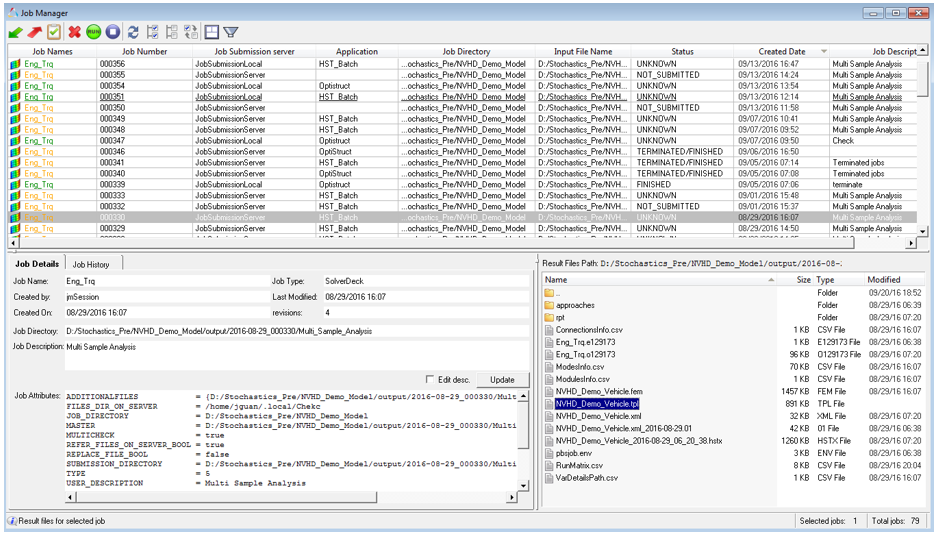
Figure 2. Selecting a file using the Job Manager
- File selection
- Select a Structures Multiple Sample Analysis template file and click Load. Upon reading the folder, the result selection fields are populated.
- MSA Details
- Details of the loaded multiple sample analysis run are populated.
- Modal Parameters
- Randomization parameters for the modal frequencies and damping.
- Connection Parameters
- Randomization parameters for the connection stiffness and damping.
- Number Of Runs
- Number of HyperStudy runs used in the analysis.
- Result selection
- The following fields are available under Result selection. Once the
result selection options are complete, select Load Response to further
investigate the results.
- Subcase
- Select an analysis subcase.
- Result type
- Select a response result type. Options include:
- Non Struct Displacement
- Acceleration
- Velocity
- Displacement
- Response ID
- Grid ID of the response for which response results are available. Select one from the list.
- Response label (optional)
- Enter a label that describes the response, for example "Driver’s Ear".
- Direction component
- X, Y, or Z.
- Review Run Matrix
- The Review Run Matrix allows you to review the randomized parameter values used in hyperstudy runs generated using the Latin Hypercube method.
- Display Options
- The Display Options dialog allows you to customize the response plot, including scale, weighting, and the plot layout.
- Load Response
- Once the result selection options are complete, select Load Response to display the scatter of NVH response.
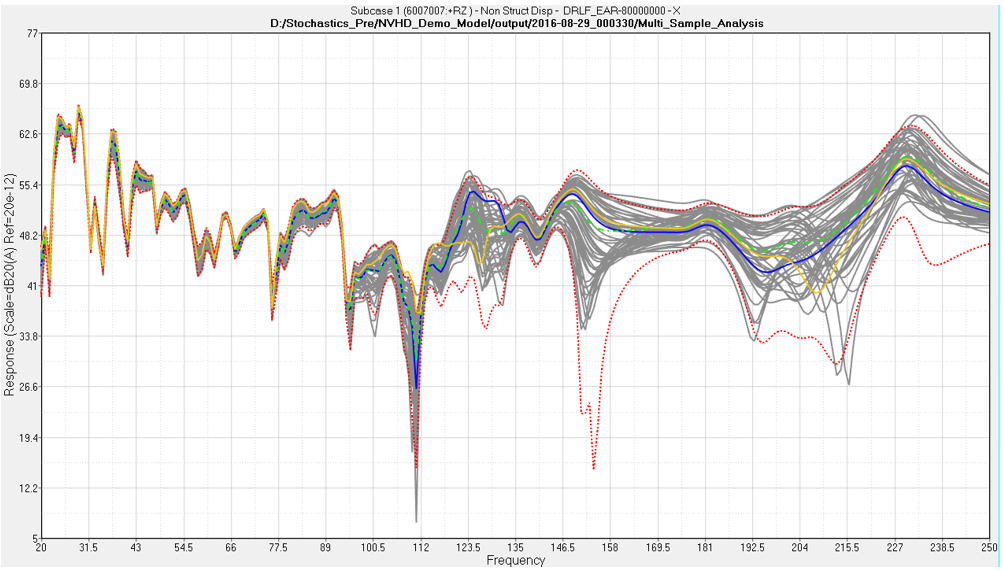
Figure 3. NVH Response Scatter plot (Structures MSA)