Multiple Sample Analysis, Structures MSA - Display
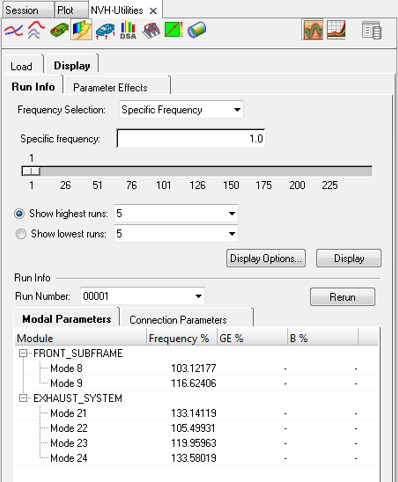
Figure 1. NVH-Utilities Browser - Display tab > Run Info (Structures MSA)

Figure 2. NVH-Utilities Browser - Display tab > Parameter Effects (Structures MSA)
In the Display tab, the Run Info sub-tab allows you to plot responses for runs with highest and lowest responses for a particular frequency or a range of frequency. It is also possible to review randomized value used for the variables in a particular run. The Parameter Effects sub-tab allows you to plot sensitive parameters contributing to response scatter at a particular frequency. To activate this tab, you must first load a file from the Load tab.
- Run Info
- Allows you to visualize responses for highest and lowest responses. Also
allows review of parameter values used in specific run.
- Frequency Selection
- Select an option to choose specific frequency or frequency range.
- Specific frequency
- Enter a specific frequency or use the slide bar to select a frequency value.
- Frequency Range
- Frequency range indicates the available range, based on your result PCH file.
- Show highest runs
- Select the number for which the you want to see the runs with highest responses.
- Show lowest runs
- Select the number for which the you want to see the runs with lowest responses.
- Display Options
- The Display Options dialog allows you to customize the plot, including scale, weighting, and the plot layout.
- Display
- Click Display to display the response plots, for chosen number of highest/lowest runs.
- Run Directory
- Select the directory with Multiple Sample Analysis runs.
- Run Number
- Click the response curve and the corresponding run number is listed. It is also possible to enter the run number manually.
- Modal Parameters
- This subtab shows the list of modules and randomized modal parameter values, frequency and damping, used in the selected run.
- Connection Parameters
- This subtab shows the list of connections and randomized connection parameter values, stiffness and damping, used in the selected run.
- Rerun
- This will allow you to generate a solver deck with randomized values of parameters in the selected run for further diagnostic. This will open a hypermesh session, load the assembly and set-the randomized values to parameters used on the specific run. Then you can export the solver deck with advanced diagnostic options for further debugging and root-cause analysis.
- Parameter Effects
- This allows you to plot sensitive parameters contributing to response scatter for a selected frequency.
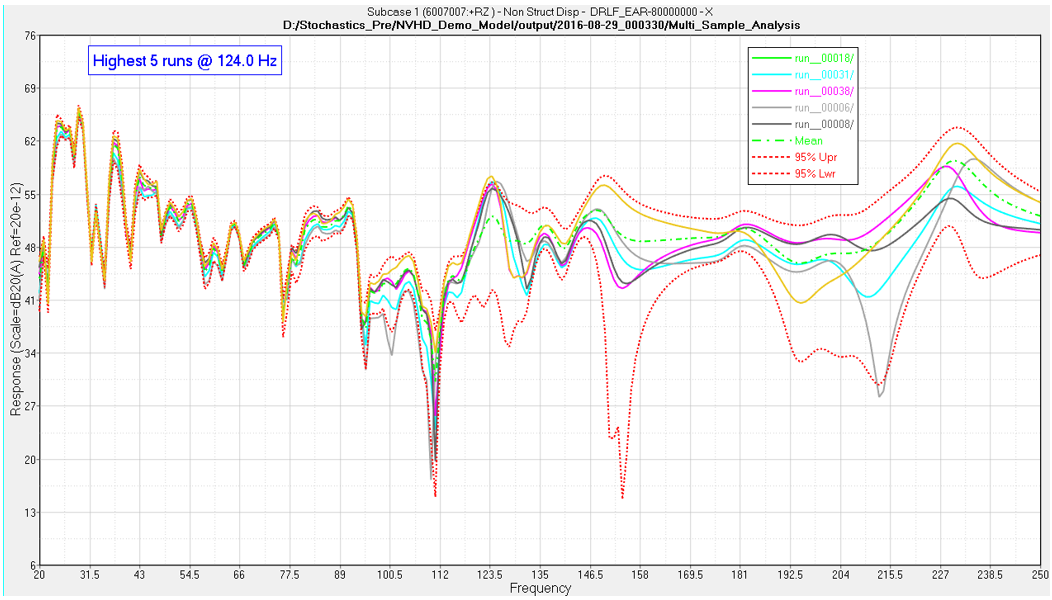
Figure 3. Highest runs (Structures MSA)
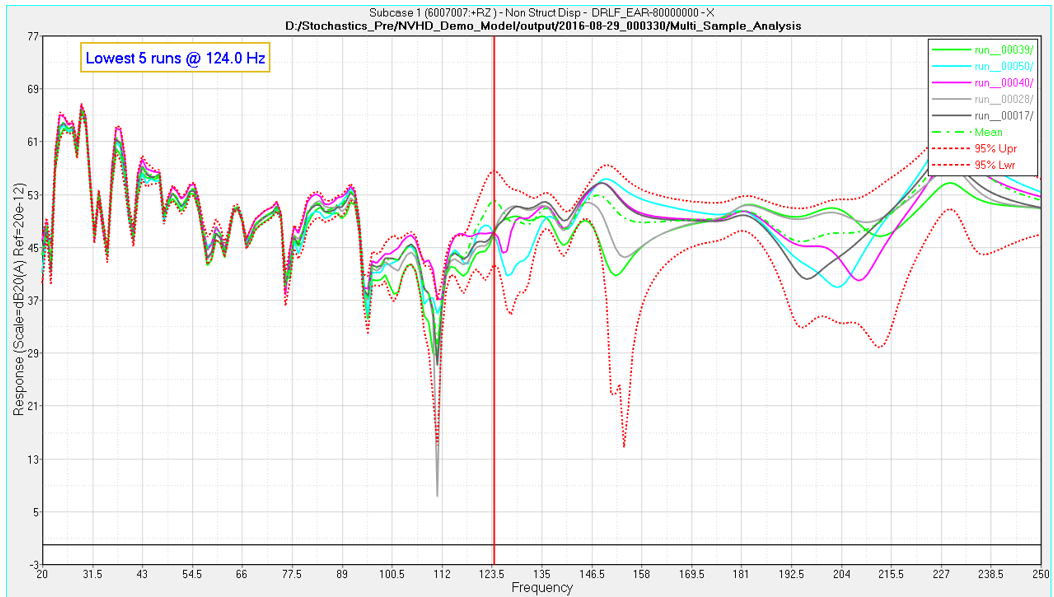
Figure 4. Lowest runs (Structures MSA)