Display Options
Customize plots using the following options
- Display
- Do not show phase - Hides the phase values on the plot.
- Scale
- The following options are available under Scale:
- Linear
- Plots the linear values.
- Logarithmic
- Plots the values in logarithmic scale. With this scale, data points are spread out more, which makes it easier to view.
- % Plot
- Plots the contribution of the selected modes as a percentage of the total response. Percentage plot is a good option to use when comparing contributors versus the total response.
- dB10
- 10 logarithmic of the participation value over the reference value.
- dB20
- 20 logarithmic of the participation value over the reference value. For acoustic responses, the reference pressure is 20E-12 MPa.
- Weighting
- A – A-weighting used to define equal loudness sound pressure levels.
- Octave Band
- Three menus allow you to customize the plot's octave band.
Select an octave band from the left-most drop-down menu:
- Octave
- 1/3 Octave
- 1/6 Octave
- 1/8 Octave
- 1/12 Octave
Select Bar Plot or Line Curve as the octave plot type from the middle drop-down menu.
Select Sum, Integration, or Average as the Octave Magnitude from the right-most drop-down menu.
Note: This option is only available for Radiated Sound.
- Unit
- Display unit information in the axes labels.
- Plot Layout
- Allows you to select how the plot window is displayed.
- New windows on current page
- Plot is placed into a new window on the current page.
- Active window
- Plot is placed into the active window.
- New windows on new page
- Plot is placed into a new window on a new page.
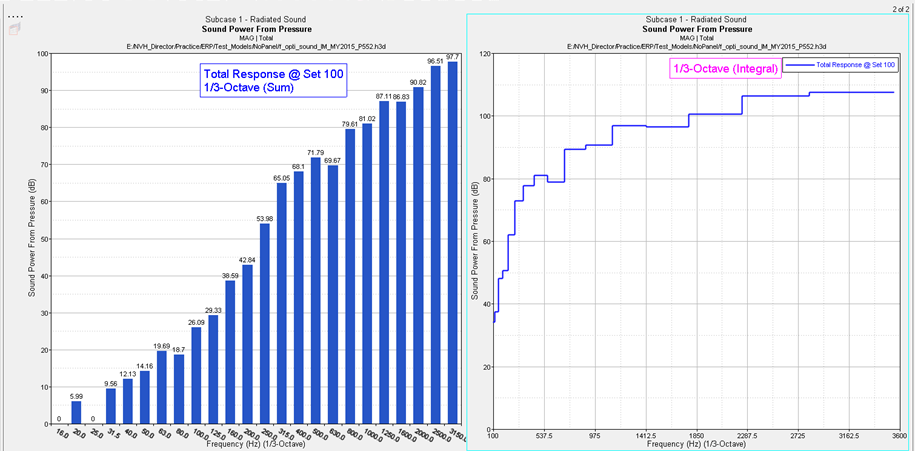
Figure 1.