Multiple Sample Analysis, Loads MSA - Display
Plot responses for runs with highest and lowest responses for a particular frequency or a range of frequency.
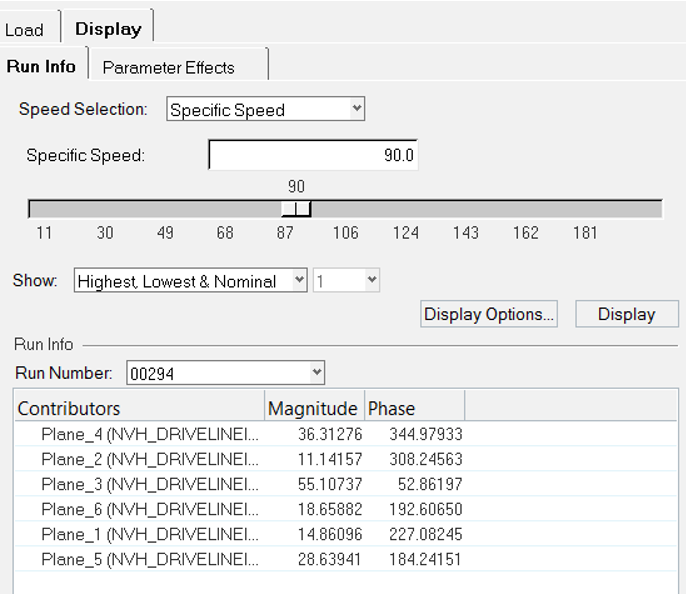
Figure 1. NVH-Utilities Browser - Display tab (Loads MSA)
It is also possible to review the randomized values used for the variables in a particular run. From the Parameter Effects tab, plot sensitive parameters contributing to response scatter at a particular frequency. Before using this tab, you must first load a file from in the Load tab.
- Run Info
- Allows you to visualize responses for highest and lowest responses. Also
allows review of parameter values used in specific run.
- Speed Selection
- Select an option to choose specific speed or speed range.
- Specific Speed
- Enter a specific speed or use the slide bar to select a frequency value.
- Speed Range
- Speed range indicates the available range, based on your result PCH file. Using the From and To fields, you can customize your own frequency band.
- Show Highest, Lowest and Nominal
- See the runs with highest, lowest and nominal runs.
- Show highest runs
- Select the number for which the you want to see the runs with highest responses.
- Show lowest runs
- Select the number for which the you want to see the runs with lowest responses.
- Display Options
- The Display Options dialog allows you to customize the plot, including scale, weighting, and the plot layout.
- Display
- Click Display to display the response plots, for chosen number of highest/lowest runs.
- Run Directory
- Select the directory with Multiple Sample Analysis runs.
- Run Number
- Click the response curve and the corresponding run number is listed. It is also possible to enter the run number manually.
- Contributors
- Review of randomized parameter value used in selected HyperStudy run.
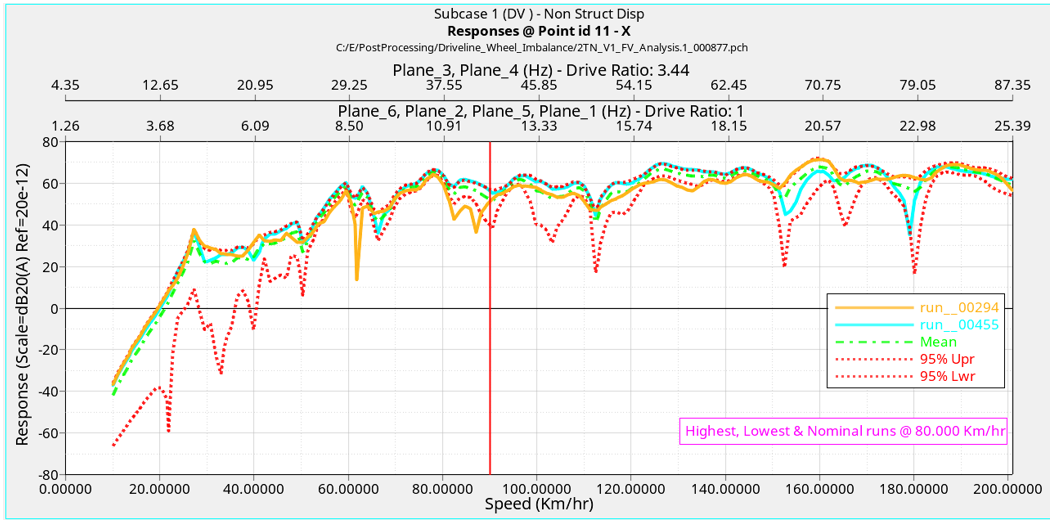
Figure 2. Response for highest, lowest, and nominal runs with respect to vehicle speed (bottom X-axis) and frequency corresponding to imbalance planes (top X-axis)