


|
[4] Using the Edit Data Table Layout
The Edit Data Table layout in the Panopticon Visualization Server lets you quickly connect to any data source and combine data from multiple sources so you can visualize all your data in a single visualization.
Connecting to data environments is easy with pre-built connectors to a wide variety of sources right out of the box.
However, to get the most of these data and produce effective visualizations, they may need to be:
q Integrated with other data sources or files to produce a data with more sense
q Transformed for normalization and aggregation
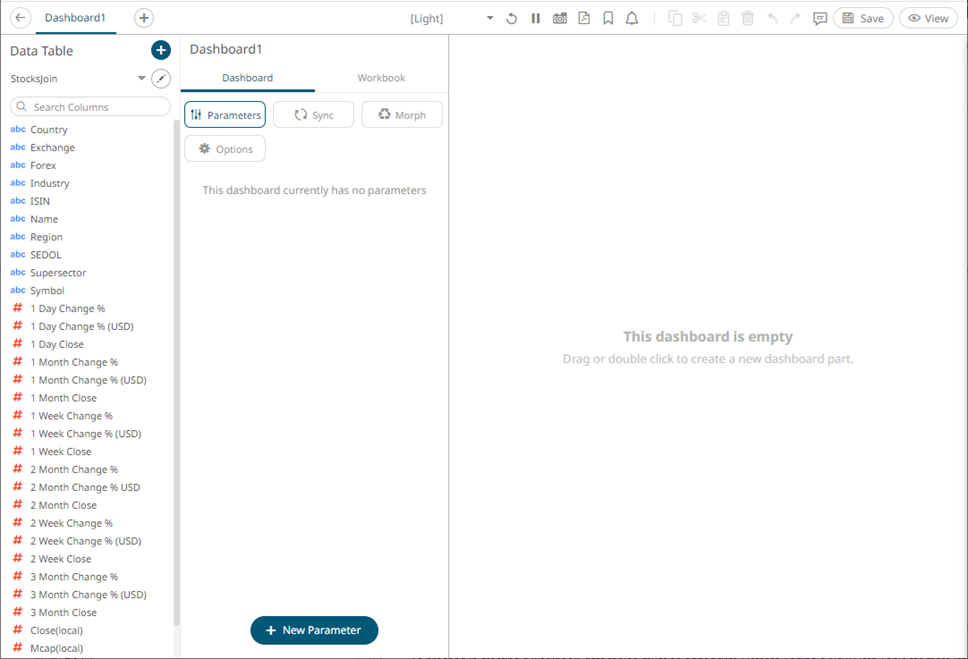
Opening the Data Table Layout
To display
the Edit Data Table layout, select the data table you want
to modify on the Data Table pane of the Open Workbook in
Design Mode layout and then select the Edit Data Table
 icon.
icon.
Note that this icon is only enabled when there is an available data table in the Edit Data Table view.
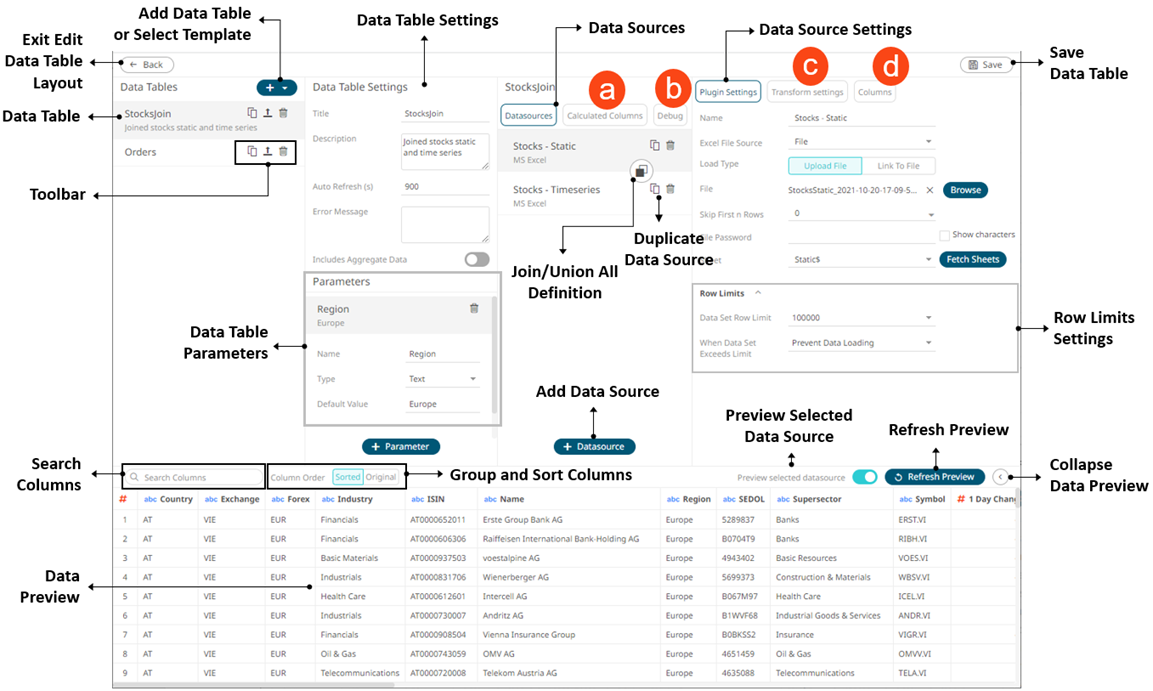
The Edit Data Table layout is displayed as below, wherein in this example, there are joined data sources:
|
Property |
Description |
|
Back |
Exit the Edit Data Table view and go to the Open Workbook in Design Mode view. |
|
Data Table |
List of data tables. Can be rearranged. |
|
Toolbar |
After the data is successfully retrieved, three options on the Edit Data Table layout allows: · Making a duplicate of the data table · Publishing the data table template · Deleting the data table |
|
Search Columns |
Allows searching of columns on the Data Sources Preview. |
|
Data Preview |
Executes the queries to return and display data. |
|
Add Data Table or Select Data Template |
Add data table or select a data table template. |
|
Data Table Settings |
Definition of the name of the selected data table, description, and the auto refresh period (in seconds). Also allows the retrieval of external aggregates and set custom message to be displayed upon unsuccessful data connection. |
|
Data Table Parameters |
Add or manage data table parameters. |
|
Group and Sort Columns |
When the Column Order is set to Sorted, the columns are grouped by type (Text, Date/Time, then Numeric) and sorted alphabetically. |
|
Data Sources |
One or more data sources that can be connected to directly, with data retrieved on the fly as it is required. Can be rearranged. |
|
Join/Union All Definition |
Allows definition of a join or union all of multiple data sources. |
|
Add Data Source |
Allows adding data sources from the available data connectors. |
|
Duplicate Data Source |
Allows creating a duplicate data source. |
|
Data Source Settings |
Displays the data source settings and allows for limiting the amount of data to be returned. |
|
Save Data Table |
Save the data table definition and go to the Open Workbook in Design Mode view. |
|
Row Limits Settings |
Allows setting of the row limit of data sources. |
|
Preview Selected Data Source |
Preview the selected data source on the Data Preview pane. |
|
Refresh Preview |
Refresh the data sources preview. |
|
Collapse Data Preview |
Collapse
the Data Preview pane. Click |
 to
expand the Data Preview pane.
to
expand the Data Preview pane.
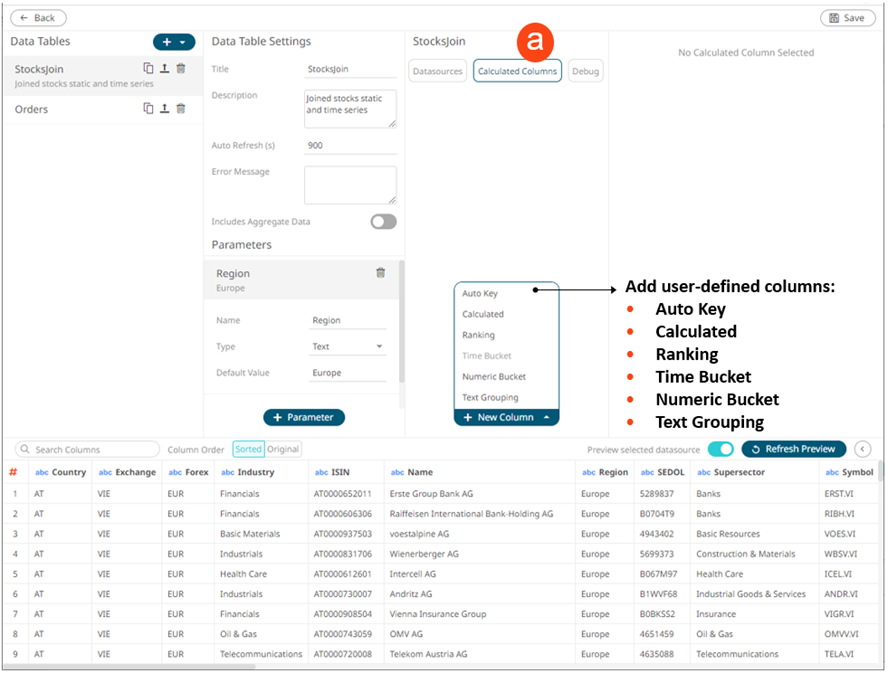
Clicking Calculated
Columns  displays
the New Column list box.
displays
the New Column list box.
|
Property |
Description |
|
Add Auto Key |
Allow creation of an auto key for the data schema on the Data Sources Preview. |
|
Add New Calculated Column |
Allows creation of a calculated column from the existing columns in the data table. |
|
Add New Ranking Column |
Allows creation of a new numeric column based on the ranking of columns in your data. |
|
Add New Time Bucket Column |
Allows creation of time buckets (categorical time analysis). |
|
Add New Numeric Bucket Column |
Allows creation of Identity, Sign, Manual, Equal Density, and Equal Distance columns. |
|
Add New Text Grouping |
Allows creation of a grouping based on source text column. |
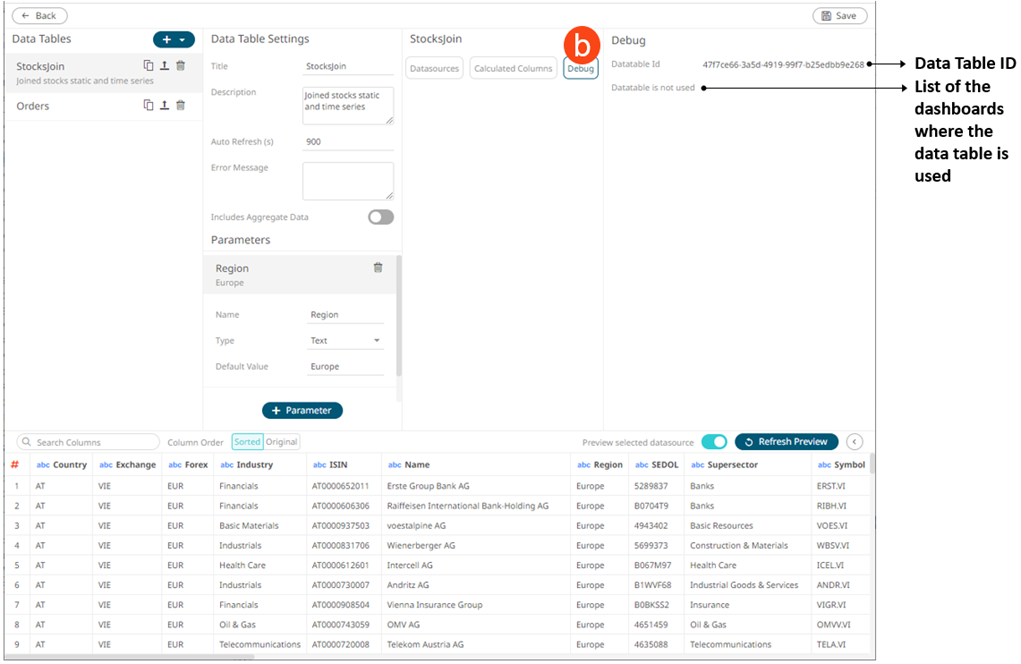
Clicking Debug
 displays the Debug
pane.
displays the Debug
pane.
|
Property |
Description |
|
Datatable Id |
Id of the data table. Can be used for parsing of server logs. |
|
Datatable is used on dashboard(s) |
List of dashboards where the data table is used. If a data table is not used, it can be deleted. |
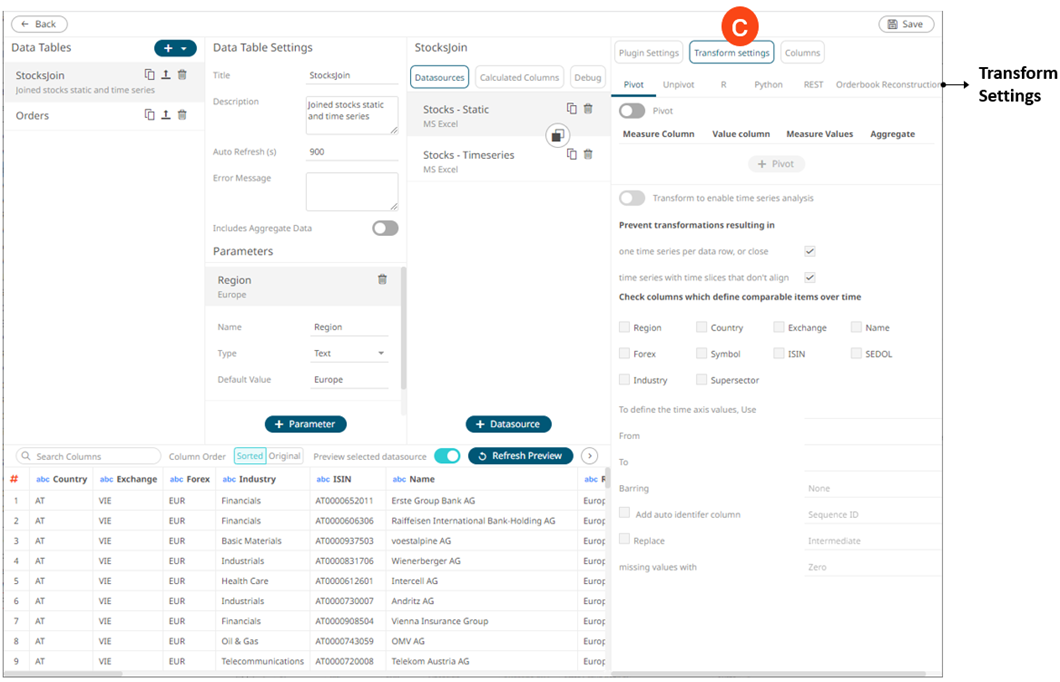
Clicking Transform
Settings  displays
the Transform Settings pane.
displays
the Transform Settings pane.
|
Property |
Description |
|
Transform Settings |
Allows you to perform the following: · pivoting or unpivoting retrieved data · transforming data to enable time series analysis including interpolation · running an R or Python script for data transformation · lists of orders to be reconstructed into an Order Book and conflated for output display |
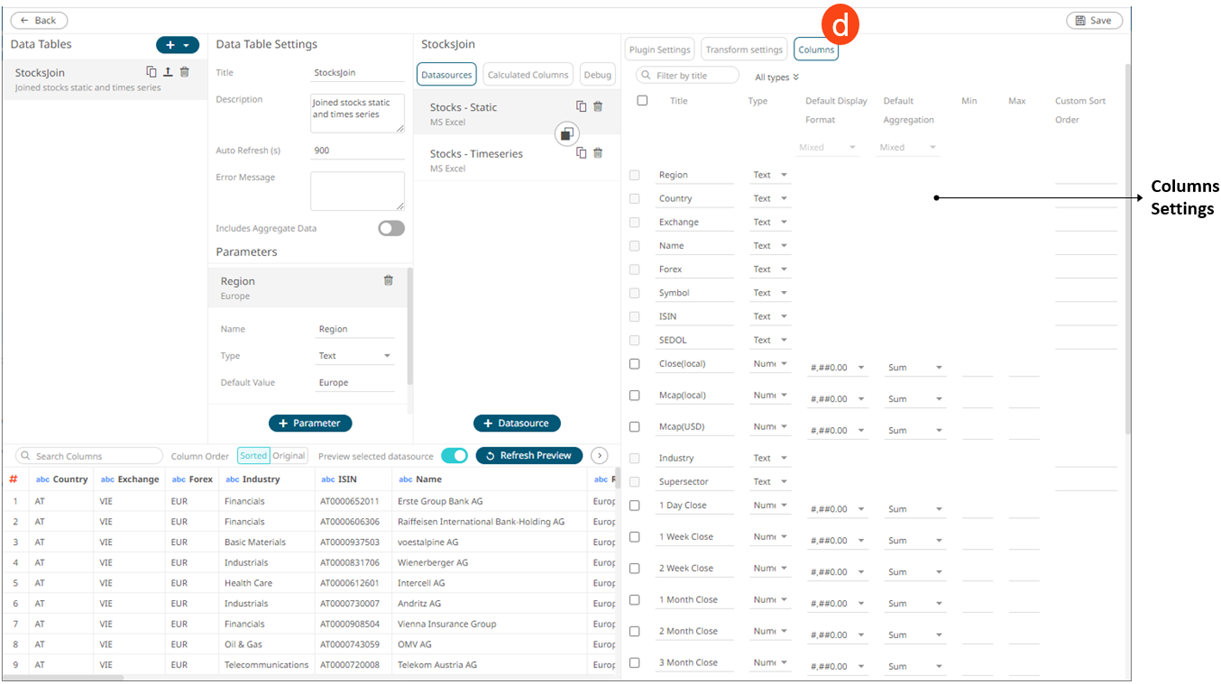
Clicking Columns
 displays
the Columns Settings pane.
displays
the Columns Settings pane.
|
Property |
Description |
|
Columns Settings |
Allows you to perform the following: · view the column data type · rename the column names · select the numeric or Date/Time format · select the numeric default aggregation · define the Min and Max range of numeric columns · define custom sort order |