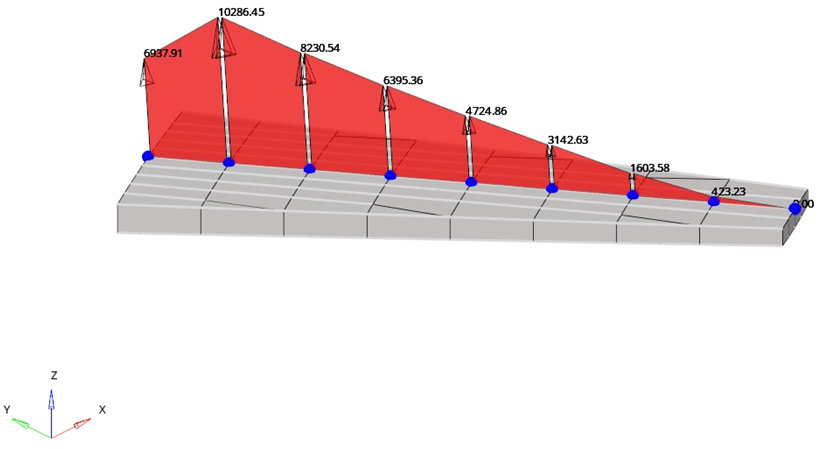
FBD Trace Plot
Display free-body forces and moments at each cross-section along a node path.

Figure 1.
- FBD Section Group
- Define one or more cross-section groups.
- Properties
- Shows all properties of a selected FBD section group
- Loadcases
- List of subcases available inside all imported result files
- Trace Plot and Display
- Visualization options
- Create a FBD section group
- Set the properties of the selected cross-section group
- Select a loadcase
- Set the options for the trace plot
- Display the trace plot for the selected loadcase
Create Free-Body Sections
- Name
- The name of the FBD section group.
- Select Node Path
- Select a node path for the FBD section group.
- Select Intersect Entity
- Select elements of interest along the node path for the FBD section group. Cross-sections on the FBD Forces tool use all elements intersecting the plane. However, the Trace Plot tool allows you to specify what elements will be considered.
- Number of cuts between nodes
- Defines the amount of extra cross-sections between each pair of selected nodes.
- Cutting plane definition
- Defines the normal direction of all cross-sections created by the Trace Plot tool.
- Direction
- Available when the cutting plane definition is set to common direction. Defines a vector to be used as the normal direction for all cross-sections.
- System definition
- Defines the system used to evaluate results.
All FBD section groups display in the Model Browser.
Set Properties of the Selected FBD Section Group
- Name
- The name of the FBD Section Group.
- ID
- The ID of the FBD Section Group.
- Color
- The color of the FBD Section Group.
- Intersect entity ids
- Select elements of interest along the node path for the FBD Section Group.
- System definition
- Defines the system used to plot results.
- System
- Available when the system definition is set to User defined. Selects a coordinate system to plot results.
- Orientation Vector
- Available when the system definition is set to Direction based. Defines the orientation vector to define the XY plane.
Select a Loadcase

Figure 2.
Trace Plot Visualization Options
Define visualization options for the trace plot.
- Load Types
- Select what type of free-body data must be shown.
- Tolerance
- Forces or moments with an absolute value lower than the tolerance are not displayed.
- Force/Moment
- Defines what force or moment component will display.
- Arrow Length (%)
- Scales trace plot for visualization.
- Numeric format
- Defines if trace plot values will display in fixed or scientific format. Also defines the amount of decimal places.
- Plot Direction
- Selects the direction of the trace plot.
- Sum At
- Selects if forces and moments will be summed at the centroid or at nodes.
- Display At
- Selects if forces and moments will display at the centroid or at nodes.
- Show values
- Select to display trace plot values.
Display the Trace Plot for the Selected Loadcase
- Click Apply to show the trace plot.
- Click Clear to hide the trace plot.

Figure 3.