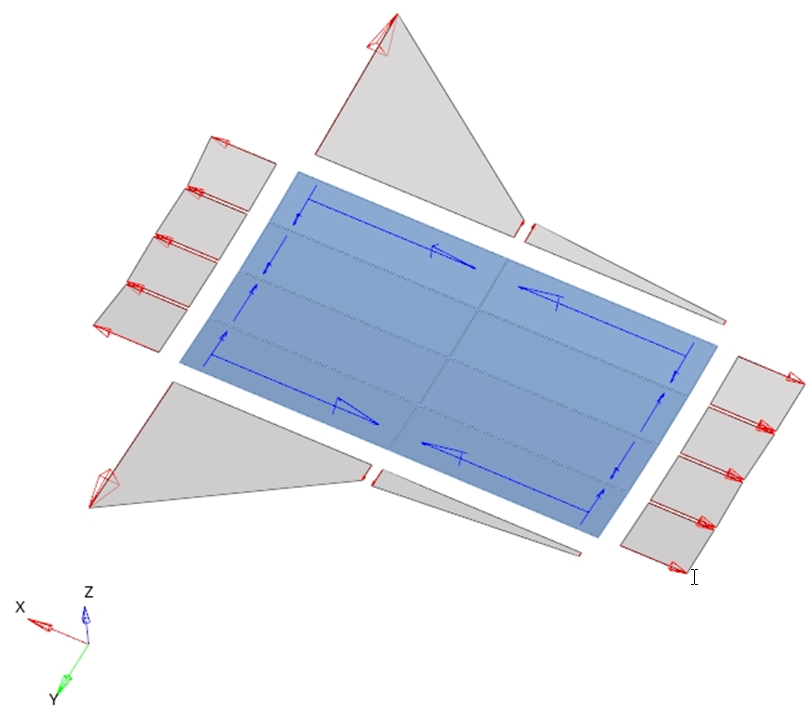
FBD Panel Plot
Display normal and shear loads of panel structural members.
From the Post ribbon, click the Panel Plot
tool.

Figure 1.
Figure 1.
Restriction: Only available in the Nastran and OptiStruct
solvers.
The tool contains the following:
- Panel Entities
- Define one or more panel entities.
- Properties
- Shows all properties of a selected panel entity.
- loadcases
- List of subcases available inside all of the imported result files.
- Panel Plot and Display
- Visualization options.
The workflow is:
- Create a panel entity.
- Set the properties of the selected panel entity.
- Select a loadcase.
- Set the options for the panel plot.
- Display the panel plot for the selected loadcase.
Create Panel Entities
Right-click and select Create.
A dialog opens.
- Name
- The name of the panel.
- Select Elements
- A group of elements for the panel.
- Find Panel
- Allows the tool to create panels based on the selected elements.
Set Properties of the Selected Panel Entity
Select a panel entity.
The properties display.
- Name
- The name of the panel entity.
- ID
- The ID of the panel entity.
- Color
- The color of the panel entity.
- Entity List
- Select elements of the panel entity.
Select a Loadcase
Select a loadcase for the panel plot.
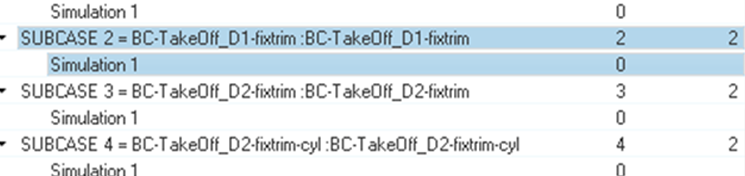
Figure 2.
Figure 2.
Panel Plot Visualization Options
Define visualization options for the panel plot.
- Evaluate by
- Select what type of data must be shown.
- Create Envelope
- Activate the checkbox to create an envelope using multiple loadcases.
- Normal Loads
- Activate the checkbox to show normal forces.
- Tangential Loads
- Activate the checkbox to show tangential forces (shear forces).
- Show values
- Activate the checkbox to display values.
- Tolerance
- Loads with an absolute value lower than the tolerance are not displayed.
- Arrow Length (%)
- Scales panel plot vectors for visualization.
- Color
- Change the color of normal and tangential loads.
- Normal Load at
- Select if the normal load will be shown at the center or at the corner of element edges.
- Numeric format
- Defines the numeric format of the values shown.
- Tables
- Creates tables with normal and tangential loads for one or multiple panels and for one or multiple loadcases.
- The summary table shows all normal and tangential loads for panel
entities.
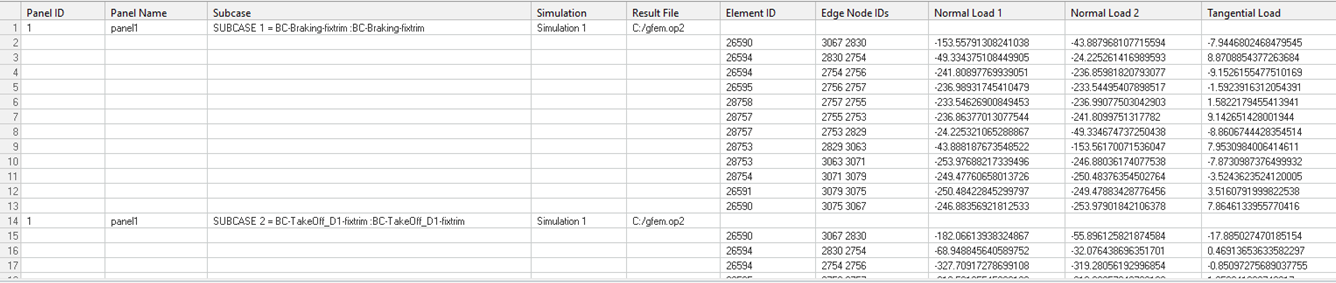
Figure 3. - The min/max table shows minimum and maximum values for normal and tangential
loads.
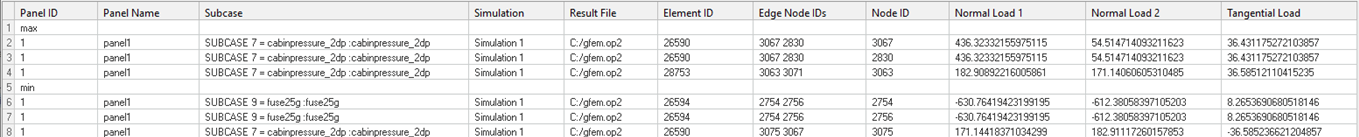
Figure 4.
Display the Panel Plot for the Selected Loadcase
- Click Apply to show the panel plot.
- Click Clear to hide the panel plot.