You can add one or more plots to compare the plot results.
When you add a plot, the parameters of the plot is auto-selected to compare the
results with the base or overlaid plots.
You can view different and suitable plot
templates' results for the overlaid plot result files using the Template
list.
Note: Refreshing of plot data is disabled for the overlaid plots.
In the plot view, click .
The Overlay panel is displayed.
Click to select the plots that you wish to
overlay.
The remote file browser, Select File dialog box is displayed. Figure 1. Select File
Note: By default, the remote file browser displays the current job
directory.
Optional: Enter a file name in the Search field to filter the
files.
Select the suitable plot file to overlay.
Click Select.
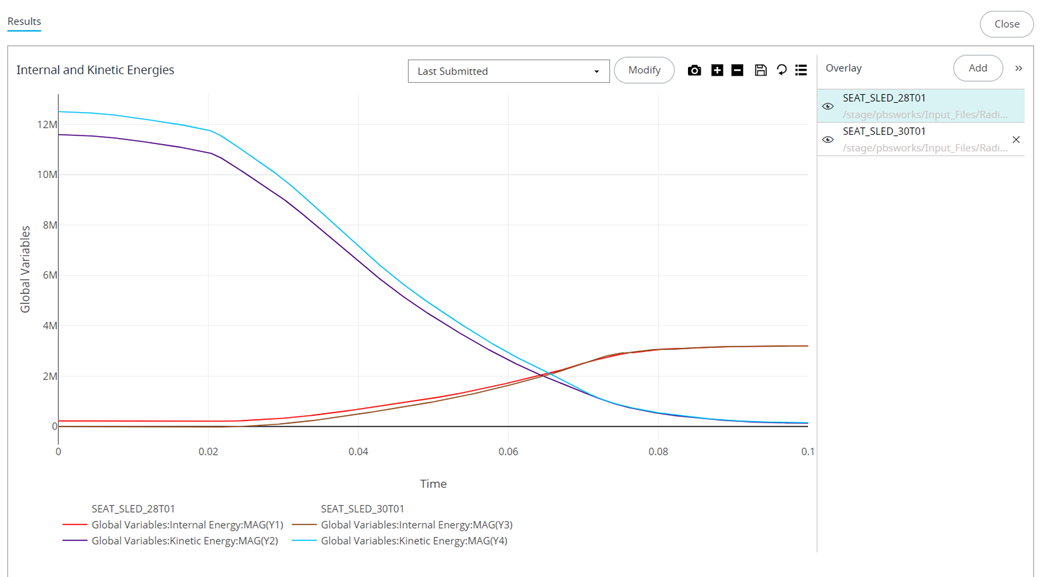
The selected plot is displayed on top of the first one. Figure 2. Overlaying Plots
You can overlay multiple plots by repeating the previous steps. The
Overlay panel displays the list of overlaid plots with the result file name and
its location.
The base plot doesn't have a remove option and the other
overlaid plots can be removed from the plot view. However, you can hide and
view all the curves displayed in the plot area using the beside the plot name in the overlay
panel.
 .
The Overlay panel is displayed.
.
The Overlay panel is displayed. to select the plots that you wish to
overlay.
The remote file browser, Select File dialog box is displayed.
to select the plots that you wish to
overlay.
The remote file browser, Select File dialog box is displayed.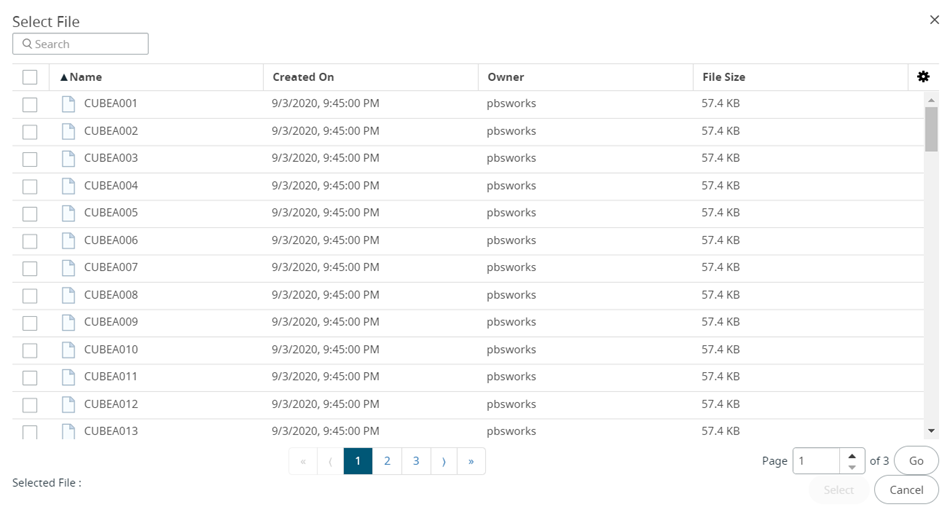
 beside the plot name in the overlay
panel.
beside the plot name in the overlay
panel.