View and Understand Simulation Results
View and understand the charts created from a simulation.
Simulation Worklow and Results
Simulations charts compare how proposed changes to a HPC system affect core utilization and job throughput.
Simulation Workflow
Stages of simulation worfklow:
- Stage 1 - Simulation
- Simulation is started and is running based on the HPC configuration and workload selected by the user. During this stage, a baseline simulation is also run which takes as input the original HPC configuration as provided by the snapshot and the workload selected by the user for the simulation.
- Stage 2 - Retrieving the Results
- Results of the simulation are retrieved.
- Stage 3 - Analysis
- Simulation results are compared to the baseline simulation results and charts are generated. Additionally, analysis results are generated for historical data which includes the HPC configuration as provided by the snapshot and the workload selected by the user for the simulation, however this data is not run through Simulate, therefore the analysis is being done on actual accounting log data.
Simulation List
Any simulations that are running or complete are available for viewing via the Simulation list. The Simulation list provides a summary for each simulation containing the following information:
- Simulation
- Simulation name and description.
- State
- Denotes the status of the simulation.
- A progress bar indicates the simulation is running.
- A spinner
 indicates that simulation is being analyzed.
  indicates that the simulation is complete.
  indicates that the simulation has been killed or has
failed.
indicates that the simulation has been killed or has
failed.
- Date
- Date and time that simulations is started.
- Mode
- Type of simulation. Currently, only a manual simulation (case study) is available.
- Source
- Name of the snapshot used for the simulation.
- Baseline Check
- A fitness metric that compares the baseline simulation analysis results to the historical data analysis results. Scores closer to 100 indicate that the simulated behavior of your HPC cluster is similar to the behavior of your actual HPC cluster.
- Utilization
- Percentage of core utilization indicates how efficiently the HPC's CPUs are being utilized. A score for both the simulation and the baseline simulation are displayed for comparison.
- 90th PCTL Wait Time
- The 90th percentile of wait time indicates the value for which 90% of the job waittimes are smaller and 10% are bigger. A score for both the simulation and the baseline simulation are displayed for comparison.
Simulation Charts
After a simulation is complete, two charts are generated providing information about job throughput and core utilization:
- 90th Percentile of Waittime by Server
- Percentage Core Utilization by Server
These charts compare the results of the simulation with the results of the baseline simulation.
90th Percentile Waittime
The 90th percentile of waittime indicates the value for which 90% of the job waittimes are smaller and 10% are bigger. Statistically, to calculate the 90th percentile value:
- Sort the job waitimes in numerical order.
- Remove the top 10% instances.
- The highest value left is the 90th percentile.
The results of the simulation in the example below shows the 90th percentile of waittime is .40 hours as compared to the baseline of .43 hours. Therefore, 90% of jobs had a waittime less than or equal to .40 hours and 10% of jobs had a waittime greater than .40 hours. A slight decrease in the 90% percentile value occurred based on the simulation's proposed HPC configuration changes.
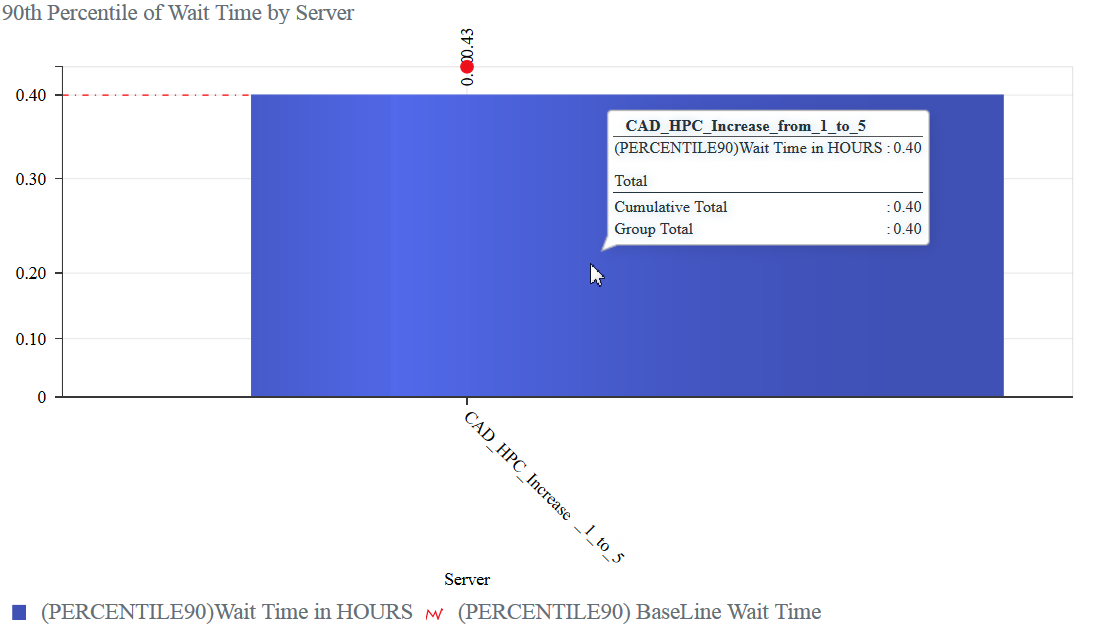
Figure 1. 90th Percentile Waittime
Percentage Core Utilization
The percentage core utilization indicates how efficiently the HPC's CPUs are being utilized. In the below example, the proposed changes to the HPC had a slight negative impact on core utilization, decreasing it from 28.95% to 26%.
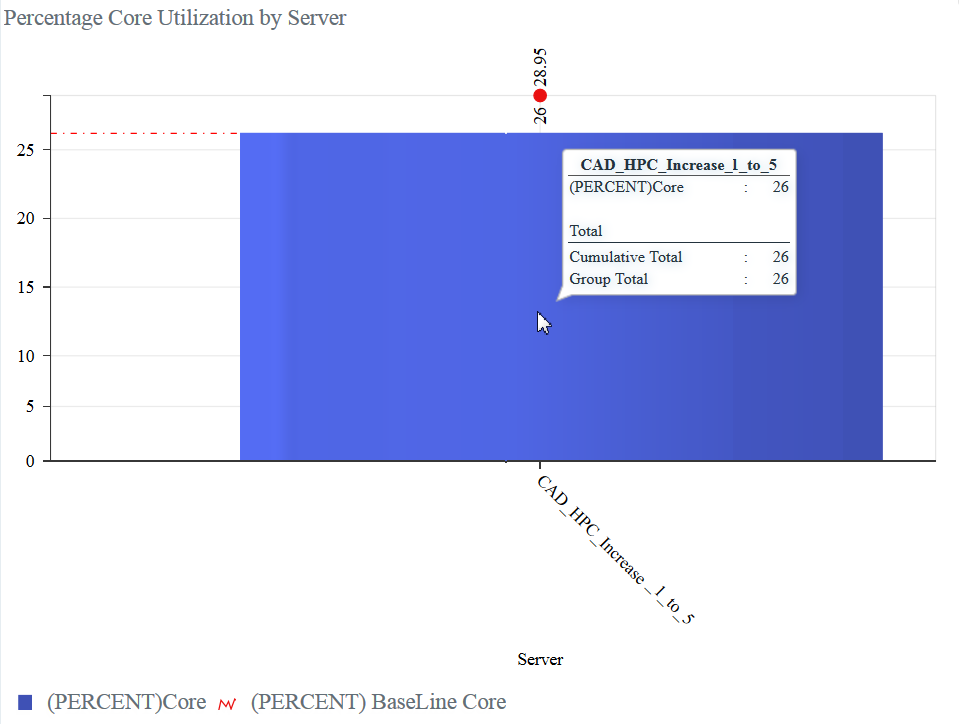
Figure 2. Percentage Core Utilization
View the Results of a Simulation
View the charts created as the result of a manual or parameter sweep simulation.
-
Click on the name of the simulation.

Figure 3. View the Results of a SimulationThe New Simulation page is displayed. You can view the simulation charts, Workload dates, Node Classes and PBS Professional Scheduling parameters associated with the simulation.