Review the hotspot search results in a tabular form by clicking the table icon
.
A table containing a hotspots list is displayed in the modeling area.
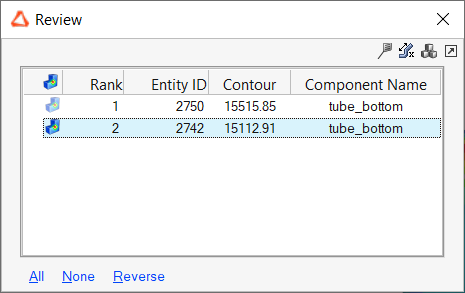
Optional: Undock the table from the guide bar to drag and move it around the screen, by
clicking the icon on top right corner of the table.
Show or hide the hotspots from the modeling window using the row
highlighter.
Figure 1.
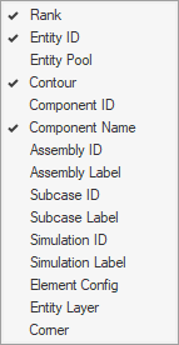
To show additional data in the hotspot review table, right-click on the column
header in the table and select the required data about the hotspot.
Figure 2.
You can also hide the unwanted components from showing up in the hotspot tour,
by clicking the icon on the guide bar to open the Show hide
tool.
After selecting the components or elements to hide from screen, right-click
twice to get back to the Hotspot Finder guide bar and hit the Play button.
Note: The entities hidden using this option will stay hidden as long as you
are in the hotspot tour.
Change the hotspots viewing mode using the drop-down menu on the guide
bar.
Figure 3.
The Global view category consists of view modes that will show the
hotspots in the perspective of the entire (global) model. All hotspots from the
current query will be shown and depending on the choice of mode, selected or
entire details around the hotspots will be shown. The masked portions will be
shown using transparency to provide a global perspective.
Navigate through the hotspots using the First,
Previous, Next, or
Last buttons located on the guide bar .
 .
A table containing a hotspots list is displayed in the modeling area.
.
A table containing a hotspots list is displayed in the modeling area.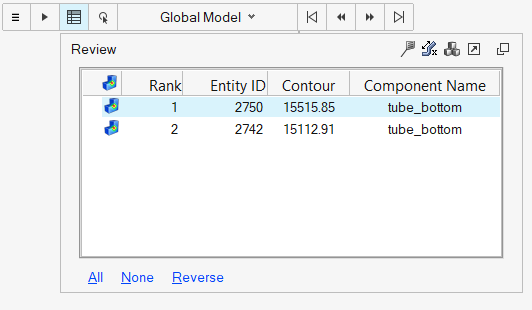
 icon on top right corner of the table.
 icon on the guide bar to open the Show hide
tool.
After selecting the components or elements to hide from screen, right-click twice to get back to the Hotspot Finder guide bar and hit the Play button.Note: The entities hidden using this option will stay hidden as long as you are in the hotspot tour.
icon on the guide bar to open the Show hide
tool.
After selecting the components or elements to hide from screen, right-click twice to get back to the Hotspot Finder guide bar and hit the Play button.Note: The entities hidden using this option will stay hidden as long as you are in the hotspot tour.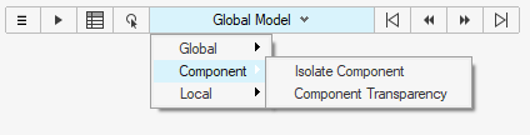
 .
.