Application and Outputs
The post processing of the results is possible using the Altair product, HyperLife. The steps involved in the process are described in the Stress-Life (S-N) Approach tutorial.
- Damage and Life contours
- Damage and Rainflow matrix
- Range pair damage
- Pseudo damage
The first two result pairs (the damage and life contours and damage and rainflow matrix) can be calculated only for flexible components.
Apart from the predefined outputs, other outputs that are of interest can also be created within MotionView.
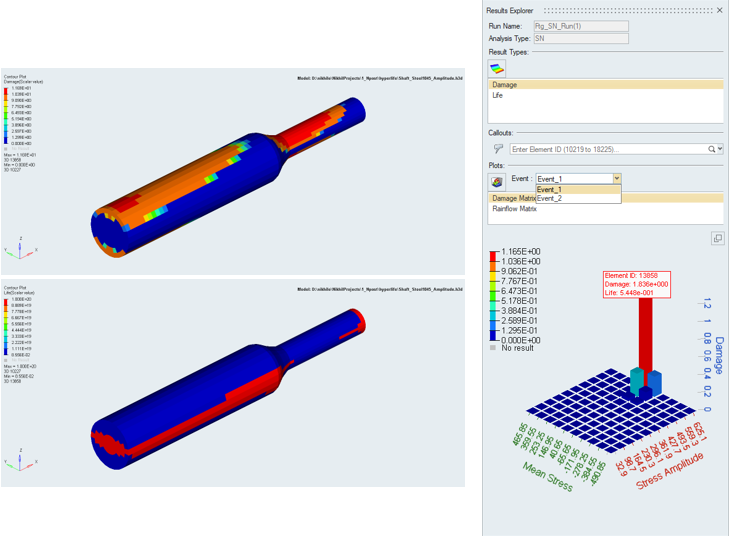
Figure 1.
Life Contour
The contour plot for Life shows the available life for the given fatigue analysis. It represents the number of cycles until the part will experience failure due to fatigue.Damage Contour
The contour plot of the damage is calculated for a given design life. The damage is the design life divided by the available life. When the damage values calculated are greater than 1, it is an indication of failure before the design life is reached.The Rainflow Matrix and the Damage Matrix may be used in the case of variable amplitude fatigue analysis. In a variable amplitude loading history, equivalent constant amplitude cycles must be identified. The fatigue damage for all the cycles in the loading history are summed to obtain the damage for the entire loading history.