psd
Power spectral density function.
Syntax
psd(time, amplitude)
Argument
- time
- The vector of times at which the signal is sampled.
- amplitude
- The vector of signal amplitudes on which the PSD is to be performed.
Example
| Curve Math Vectors | Results |
|---|---|
p1w1c1.x = (0:255:1)/512 |
Given c1, a curve is created which contains the values of 1 + x2 from 0 to 10. |
p1w1c1.y = 6 +
|
The vector of signal amplitude samples. |
x = fold(freq(p1w1c1.x))/2 |
The vector of frequencies. |
y = fold(psd(p1w1c1.x, p1w1c1.y)) |
The vector of PSD values. |
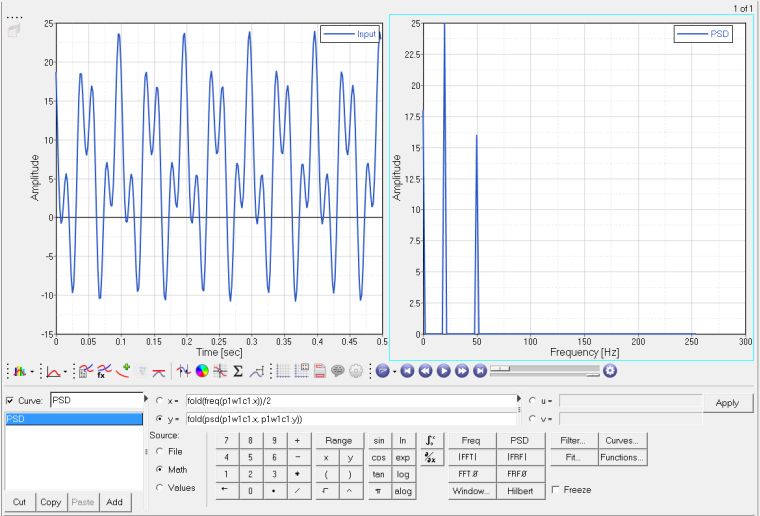
Figure 1.
The fold function is used with x and y to display the one-sided spectrum above.
Comments
The resultant vector has a number of elements equal to the least power of two greater than the number of elements in the argument. The Fast Fourier Transform (FFT) is used to calculate the PSD. The PSD is given by:

where N is the number of points in the amplitude argument and Δt is the sampling interval, the difference between the first two points in the time argument. Both time and amplitude are assumed to be evenly sampled.
There are other ways to represent the PSD arithmetic. This method relates the calculation to the arguments in the function signature.
The example PSD computations can simplified as follows.
PSD(0) = 6^2 * (256/512) = 18
PSD(20) = 0.5 * 10^2 * (256/512) = 25
PSD(50) = 0.5 * 8^2 * (256/512) = 16
The leading 0.5 factor in the PSD(20) and PSD(50) values comes from the RMS power of the sinusoid components.