logint
Logarithmic interpolation function.
Syntax
logint(old_x, old_y, new_x, flag)
Argument
- old_x
- The x vector of the curve to be interpolated.
- old_y
- The y vector of the curve to be interpolated.
- new_x
- A scalar or a vector containing x values for which new y values are to be calculated.
- flag
- 0 - results in both axes being logarithmically scaled.
Example
Flag 0 results in both axes ben logarithmically scaled.
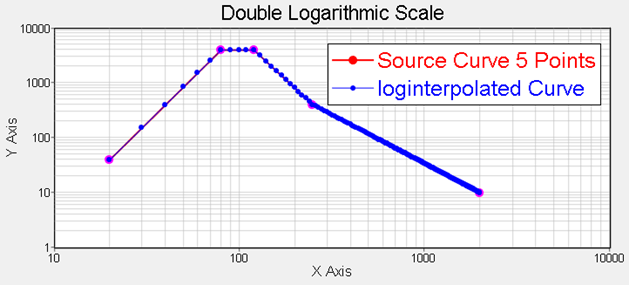
Figure 1.
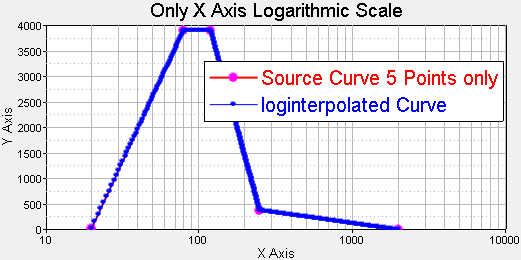
Figure 2.
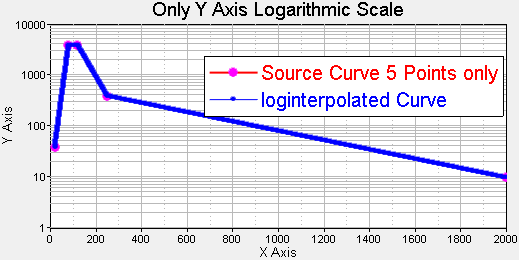
Figure 3.
| Curve Math Vectors | Results |
|---|---|
x = new_x
|
Given c1, a curve is created with interpolated y values at each point of new_x. |
Comments
The logint function uses linear interpolation to resample data. logint estimates a y-value for each element in new_x such that the new points lie on or near the curve defined by old_x, old_y. old_x, old_y and new_x must have the same number of elements.
If old_x is not entirely increasing and new_x is a scalar, the first value of old_x is used. If new_x is a vector, old_x must be entirely increasing.
If new_x is a scalar, the result is a scalar. If new_x is a vector, the result is a vector with the same number of elements as new_x.
logint performs interpolation only. All values of new_x must lie between the minimum of old_x and the maximum of old_x.