HG-1010: Change Curve Display Attributes
In this tutorial, you will learn how to change the curve display attributes.
- Use the Headers/Footers panel
- Change curve attributes
- Use the Notes panel
- Use the Options panel and style sheets
- Click the Headers/Footers panel icon in the toolbar,

- From the menu bar select Annotations > Headers/Footers
The Headers/Footers panel allows you to add headers and footers to your plots, specify font style and color, position the titles, and turn them on and off.
- Click the Curve Attributes panel icon in the toolbar,

- From the menu bar select Curves > Curve Attributes
This panel allows you to change curve attributes such as line style, color, and weight as well as symbol style and color.
- Click on the Options panel icon,

- From the menu bar select Preferences > Options
This panel allows you to change the color of a XY plot window’s background, frame, grid lines, and zero line.
- Click on the Notes panel icon,

- From the menu bar, select Annotations > Notes
This panel allows you to annotate plots. Notes are text boxes placed in plot windows for labeling points, describing trends, and relating additional curve information. You can create logic and expression-based notes using Templex.
- Right-click in the plot window and select HG ApplyStyle…
- The Apply Style dialog allows you to quickly apply a plot window’s attributes across all plot windows on the current page, or on all pages in the plot.
Open Session File demo_3.mvw
- From the File menu, click .
- From the plotting folder, select the demo_3.mvw file and click Open.
Change the Header for Window 1 to REQ/3 force
- Verify that window 1 on Page 2 is active.
-
Click on the Headers/Footers panel icon,
 .
.
- From the Header tab, replace the name REQ/3 curve 3 with REQ/3 force and press ENTER
-
Change the header font size by clicking the font button,
 .
.
- Change the color of the header from the color palette.
Change the Line Style for the Curves in Window 1
-
Click the Curve Attributes icon,
 .
.
- From the Curves list, select X, Y, and Z.
- From the Line Attributes tab, change the thickness of the curves.
Change the Frame Color for Window 1 to Yellow
-
Click on the Options panel icon,
 .
.
- From the Color tab, select the option Frame.
- Select yellow from the color palette.
Apply the Window and Curve Display Attributes of Window 1 to the Other Plot Windows on Page 2
- In window 1, right-click and select HG ApplyStyle… from the pop-up menu to open the Apply Style dialog.
- Select Current page.
- Activate only the attribute options Plot, Header, and Curves. Deactivate all other options.
- Click OK to apply the active attributes to the other plot windows on page 2.
Create a note and Attach to a Curve in Window 1, Page 2
-
Enter the Notes panel,
 .
.
-
Under Find point, click the Maximum button,
 , to attach the note to the curve’s maximum Y
value.
, to attach the note to the curve’s maximum Y
value.
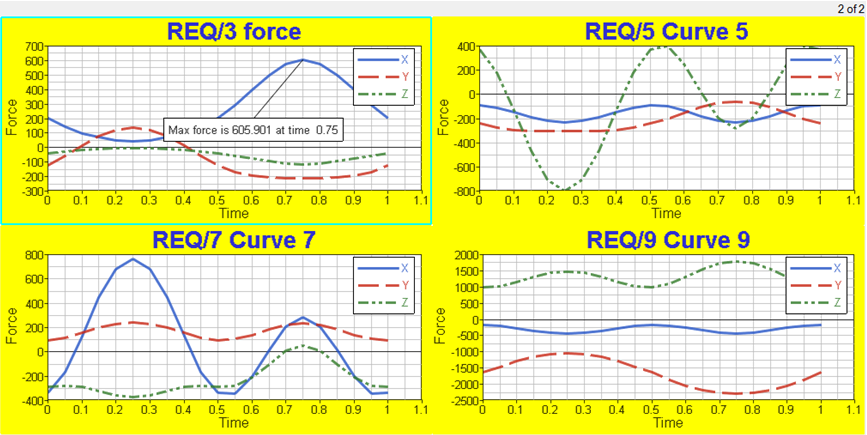 Figure 1.
Create and Attach a Second Note with Templex to a Curve
While in the Notes panel, do the following: