HG-1021: Modify Plots with the Plot Browser
In this tutorial, you will learn how to modify plots with the Plot Browser.
You can use the Plot Browser tools to search, display and edit entities and their properties within the current session.
- Modify the following plot attributes
- Header font size
- Legend position and font size
- Axis fonts
- Modify the following curve attributes
- Curve name and prefix
- Line style
- Color
- Add notes attached to curves
- Modify notes in the Notes panel
- Apply these changes to all notes using the Plot Browser
The HyperGraph 2D Plot Browser resides on a tab in the Tab Area sidebar and allows you to view the HyperGraph 2D plot structure.
The Plot Browser can be turned on or off using the menu options. A check mark indicates that the HyperGraph 2D Plot Browser is activated for display in the Tab Area.
You can use the Plot Browser tools to search, display and edit entities and their properties within the current session.
Open Session File demo_browser.mvw
- From the File menu click .
- From the plotting folder, select the demo_browser.mvw file and click Open.
Modify the Header Font Size
-
From the Plot Browser tab, click the Headers/Footers icon,
 , from the top of the browser.
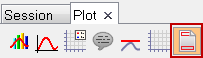 Figure 1.
 These icons allow you to filter the data that is displayed in the Plot Browser. For example, by clicking the Headers/Footers icon, only the header and footer information for each curve in your session is displayed in the browser.
-
Right-click on Header and select Select All.
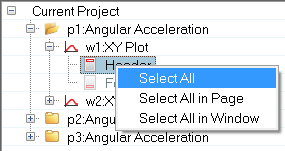 Figure 2.
 This action selects all the headers for each curve listed in the Plot Browser. By doing this, you can modify a header attribute only once, but it will be applied to all headers.
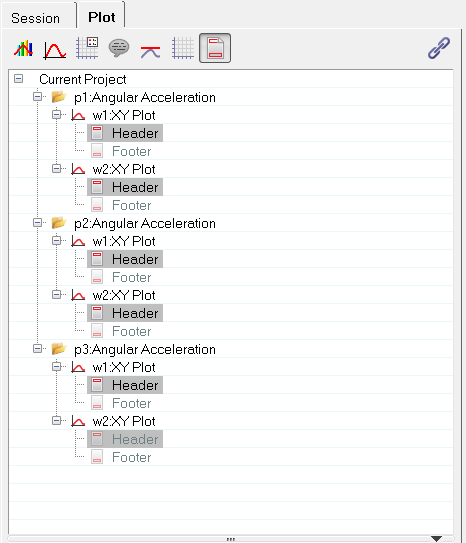 Figure 3.
 -
From the Properties Table at the bottom of the Plot Browser, select the font setting field next to Primary Font Settings.
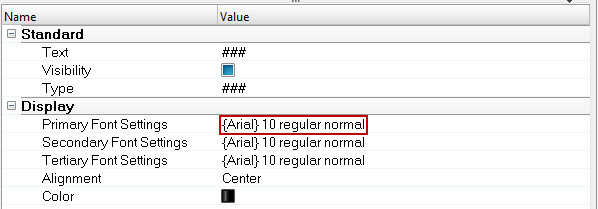 Figure 4.
 The Font Selector dialog is displayed.
Modify the Legend Font Size and Change the Legend Position
-
From the Plot Browser tab, click the Legends icon,
 , from the top of the browser.
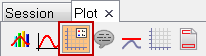 Figure 5.
 These icons allow you to filter the data that is displayed in the Plot Browser. For example, by clicking the Legends icon, only the legend information for each curve in your session is displayed in the browser.
-
Right-click on Legends and select Select All.
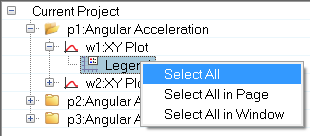 Figure 6.
 This action selects all legends for each curve listed in the Plot Browser. By doing this, you can modify a legend attribute only once, but it will be applied to all curve legends.
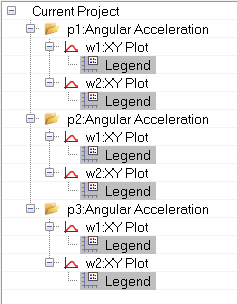 Figure 7.
 -
From the Properties Table at the bottom of the Plot Browser, select the
Font Settings field.
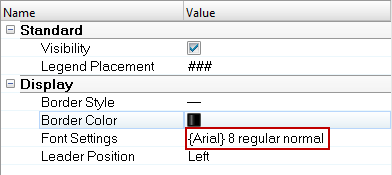 Figure 8.
 The Font Selector dialog is displayed.
Modify the Axis Font Size
-
From the Plot Browser tab, click the Axes icon,
 , from the top of the browser.
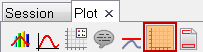 Figure 9.
 These icons allow you to filter the data that is displayed in the Plot Browser. For example, by clicking the Axes icon, only the axes information for each curve in your session is displayed in the browser.
-
Right-click on the icon for the horizontal primary axis and select
Select All.
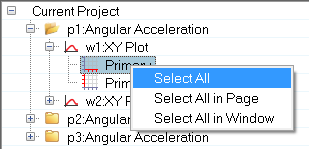 Figure 10.
 This action selects all horizontal axes for each curve listed in the Plot Browser. By doing this, you can modify a horizontal axis attribute only once, but it will be applied to all horizontal axes.
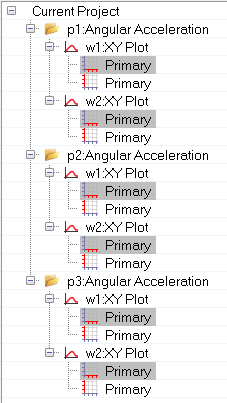 Figure 11.
Modify the Curve Name
-
From the filter icons at the top of the Plot Browser, select the Curves icon,
 .
.
-
Right-click on the curve name c1:50th% Hybrid 3 - LOWER TORSO -Res
ang and select Select All.
All curve names in the Plot Browser are selected.
The curve names contain the request and component information.
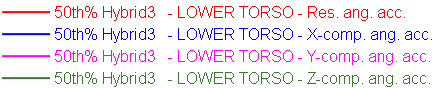 Figure 12.
 Next, remove the Y Request from the curve name.
-
From the Properties Table, click the Label drop-down
menu and deselect the Y Request option.
The curve names shown in the graphics area now only contain the Y Component name.
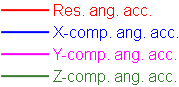 Figure 13.
 -
In the Label Prefix field, enter Test
17.
The prefix Test 17 is added to the curve name label for all plots.
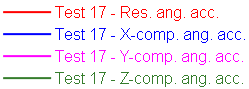 Figure 14.
Modify the Curve Line Style and Color
In this step, you will change the curve line style for all curves that contain the components XYZ.
-
Click the Add Filter icon,
 , to add a filter to
the Filter Area.
, to add a filter to
the Filter Area.
-
From the Filter Name drop-down menu, select Display
Name.
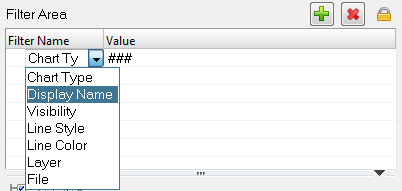 Figure 15.
 -
In the Value column, enter Res.
HyperGraph 2D searches for all the curve names that contain a resultant and display only those in the Plot Browser.
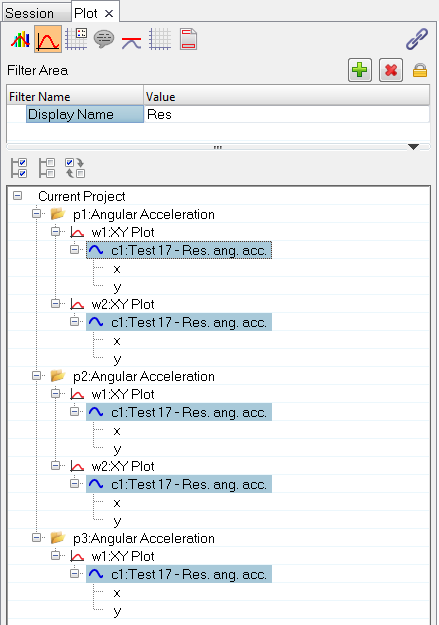 Figure 16.
 -
Delete the filter you just added by clicking the Delete
Filter icon,
 .
.
The Plot Browser displays all the other curve names that contain something other than a resultant.
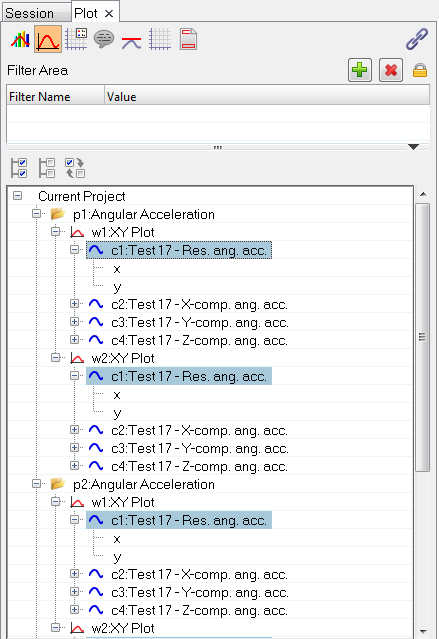 Figure 17.
 -
Click the Select Reverse icon,
 , to deselect the curves with resultant in the name and
SELECT the curves with component in the name.
, to deselect the curves with resultant in the name and
SELECT the curves with component in the name.
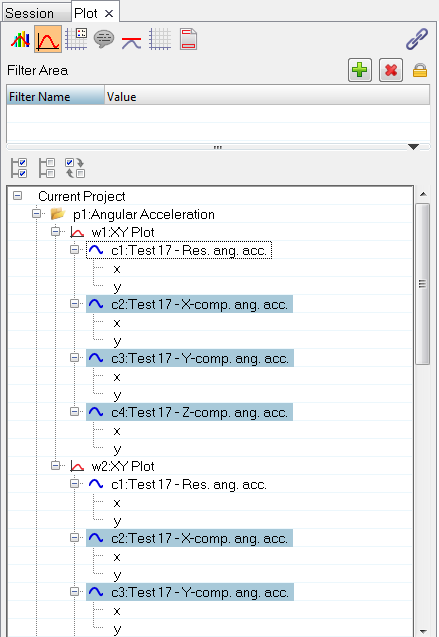 Figure 18.
 -
From the Properties Table, select the Line Style
drop-down menu and select the dashed line style.
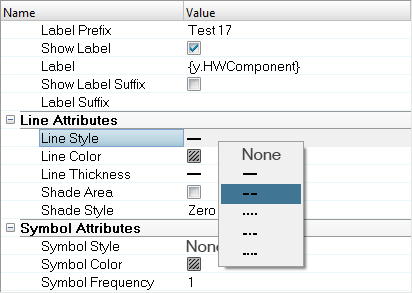 Figure 19.
 The line style is changed to a dashed line style for all curves with component in the curve name. The curve name that contains the resultant remains a solid line.
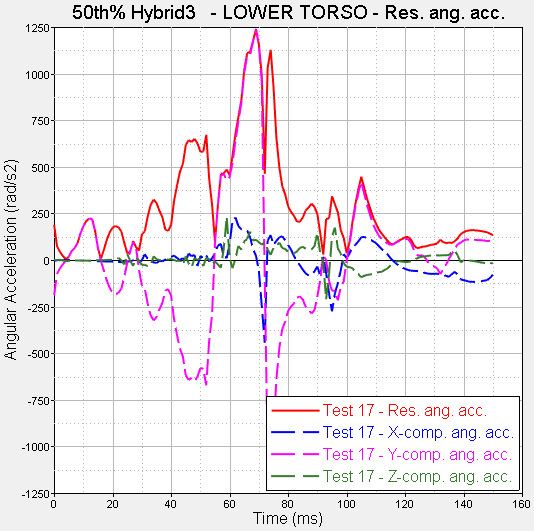 Figure 20.
 -
To change the line color of only the resultant curve, click the
Select Reverse icon again, , to deselect the component curves from the Plot Browser and select the resultant curve.
-
From the Properties Table, select the Line Color color
square and select the color black from the color palette.
Only the resultant curve changes to black.
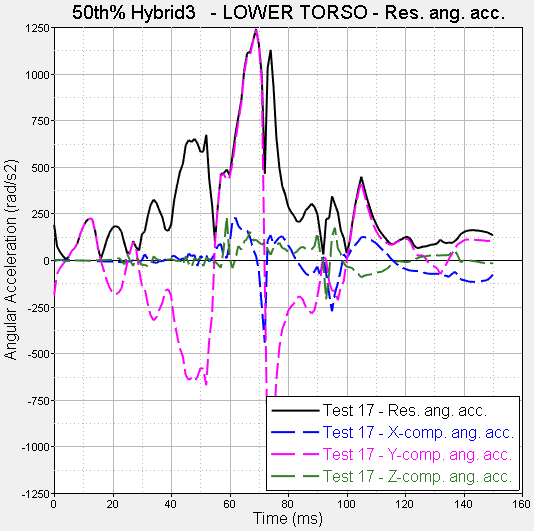 Figure 21.
Add and Modify Notes
-
Click the Add Filter icon, , to add a filter to the Filter Area.
-
Again, right-click on the first curve listed in the Plot Browser and select .
This adds a note to the maximum value of each curve in the session.
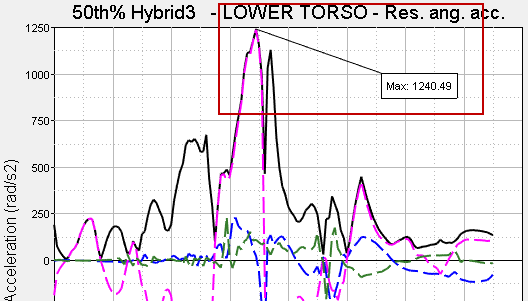 Figure 22.
Next, you will use the Notes panel to modify the note.
-
From the toolbar, click the Notes icon,
 .
.
-
In the Text tab, change Max:{Y} to this: Max of {label} =
{Y} and click Apply.
The note now displays the label information.
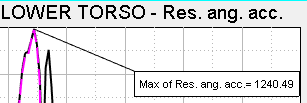 Figure 23.
 -
You can further edit the note display by added quotes around {label}, like
this: Max of "{label}" = {Y}. Click
Apply.
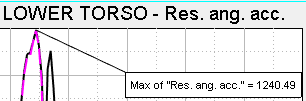 Figure 24.
 -
Edit the note one more time by adding the time to it, like this:
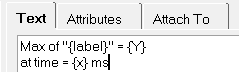 Figure 25.
 The "ms" displays the time in milliseconds.
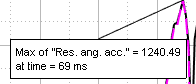 Figure 26.
Next, you will apply the note text to all the curves in the session using the Plot Browser.
-
From the Properties Table, click in the Text field.
The Note Text dialog is displayed.
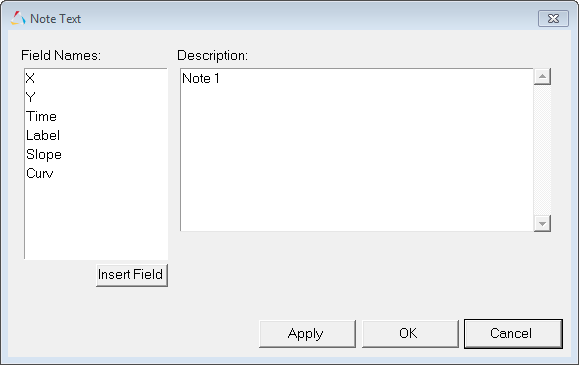 Figure 27.
 -
Press Ctrl+V to insert the text you copied from the
Notes panel and click OK.
All max notes now have the same text string applied to them.
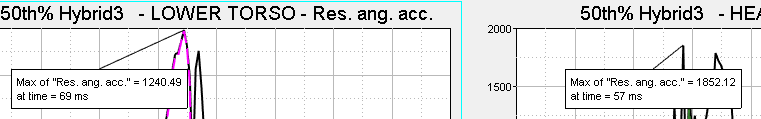 Figure 28.