Entity Visibility in the Graphics Window Using the Plot Browser
Use the Plot Browser to edit the entity visibility in the graphics window.
Click on an entity’s icon in the Plot Browser to toggle its visibility. The icon is grayed out and the accompanying text label is dimmed when the entity has been disabled, and appears normal when the entity is enabled. This is true for the following entities: Curves, Legends, Notes, Datum Lines, Axes, and Headers/Footers.
For example, in the image below, the four curves displayed in the Plot Browser are visible in the graphics window. Notice that the icon next to each curve listed under w1:XY Plot appears normally to indicate the curves are visible in the graphics area.
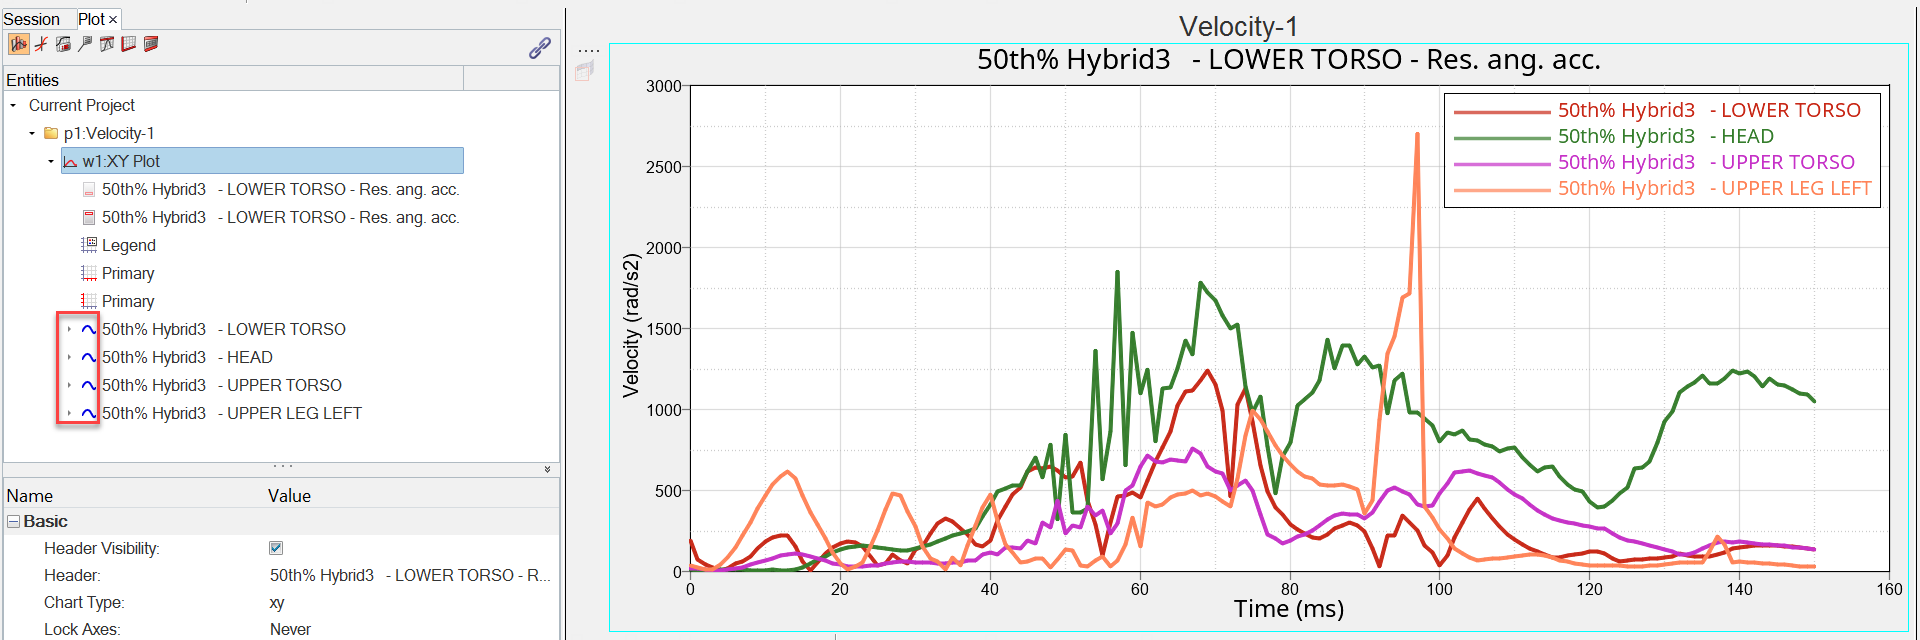
Figure 1.
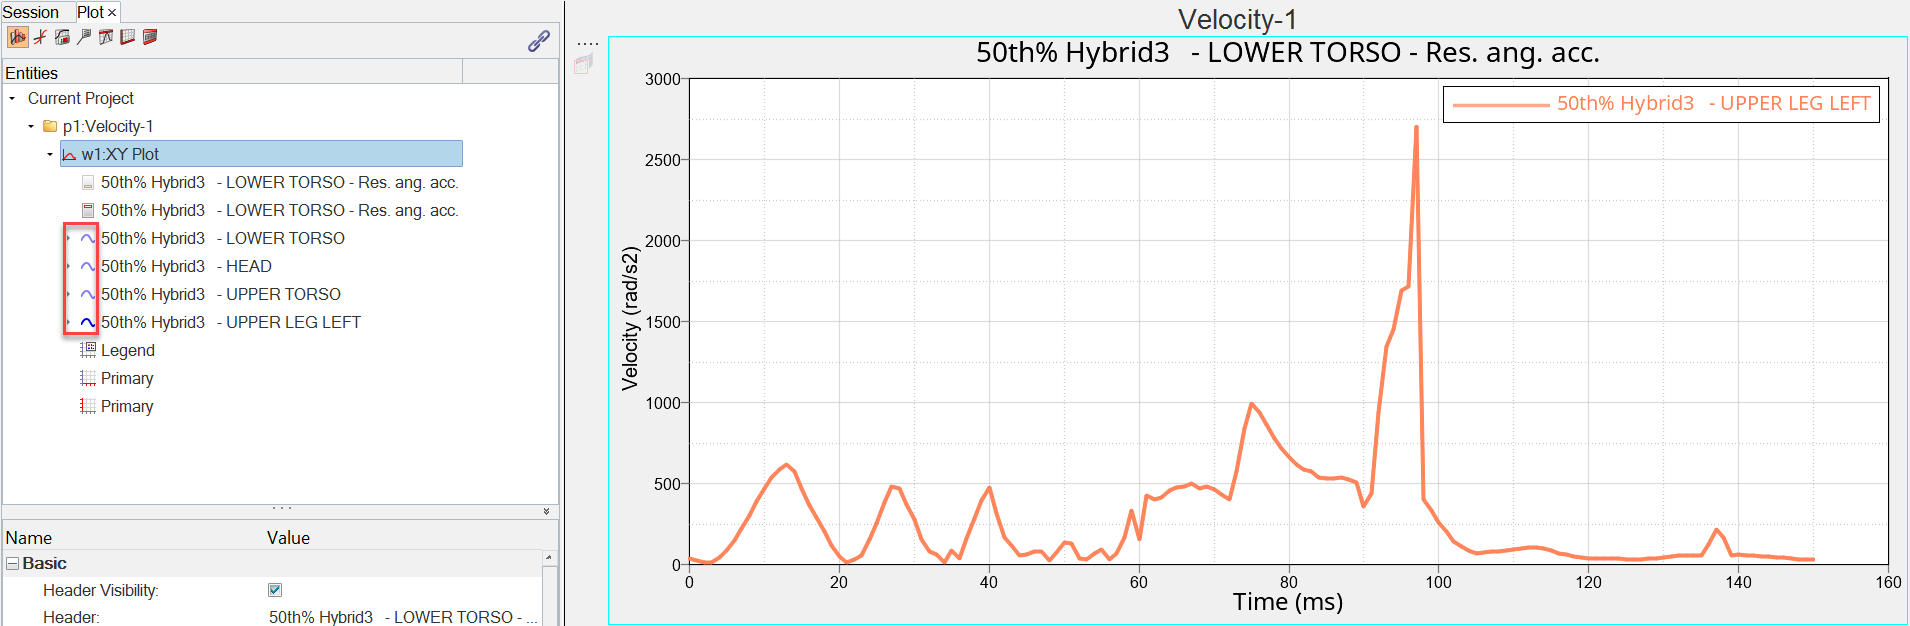
Figure 2.