Define Curves
Edit existing curves an be edited individually and new curves can be added to the current plot using the Define Curves panel.
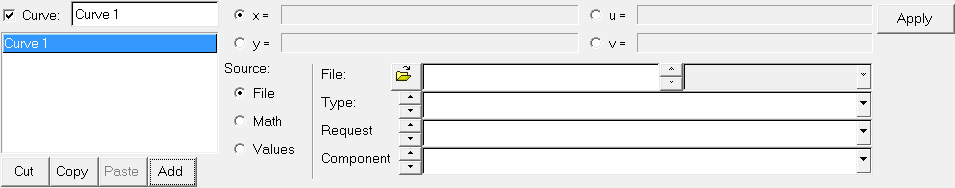
Figure 1. Define Curves
From the panel, you can access the program's curve calculator.
If *AutoDefaultCurves() is turned on in the preference file and a curve is added to a plot with existing curves, the new curve is a copy of the most recently added existing curve. If *AutoDefaultCurves() is turned off, the new curve is empty.
Please see Dynamic Curve Names for more information on this topic.
Curve List
The Curve list displays the names of the curves in the current window.
To change the attributes of a curve, it must first be selected either from the curve list or picked from the window. Attributes can be assigned to more than one curve at a time by selecting multiple curves from the list or holding down the Control key while picking curves from the window. Attributes are applied only to selected curves. Selected curves are highlighted in the list.
Curve List Controls
The curve list displays the names of all the curves in the active window.
Curves can be renamed, added, cut, copied, and pasted using the curve list controls.
Individual curves can be turned on or off. To turn a curve off, select the curve from the list or pick the curve from the window and deactivate the check box next to the curve name above the curve list. To turn a curve on that was turned off, activate the check box.
The Cut, Copy, Paste, and Add buttons are used to maintain the curve list for the active window. Curves can be copied and pasted into other windows. Curves can also be added and deleted from the list.
Create and Define Curves
To edit a curve, it must first be selected either from the curve list or picked from the window.
The X,Y, U, and V vectors are displayed at the top of the panel. The data sources for these vectors are displayed in the text fields. Click the radio button for a vector or click in the corresponding text box to select that vector for editing. You can perform math on curves prior to plotting your data with the support of u and v vectors.

Figure 2.
New data can be selected from a source file, mathematically defined using the program's curve calculator, or entered as values. The panel options change depending on which source is selected.
Constructing Curves
Expressions are constructed in the text fields next to the X and Y radio buttons. Expressions are built by clicking on numbers, operators, and functions located on the curve calculator. As the expression is built, each operator, function, and number is displayed in the text field. An expression may contain basic math functions such as addition, subtraction, multiplication, and division, as well as trigonometric and signal-processing functions. Expressions can also reference other vectors.
While the curve calculator displays only certain commonly used functions, over 100 math functions and operators are available.
See Math Reference for a detailed description of each function and its purpose.
Referencing Curves
Expressions can reference any curve or vector in the current session.
Curve vector references can be defined by picking the curve with the mouse or by using the following syntax:
pmwnco.vector
where:
m is the number of the page on which the curve resides
n is the number of the window which contains the curve
o is the number of the curve in the window
vector indicates the X, Y, or time vector of the referenced curve
For example, p2w1c3.y references the Y vector (.y) of the third curve (c3), in first window (w1), on the second page (p2).
When a referenced curve is edited or updated, the curves that reference that curve are updated as well.
Complex Plot Curves
- Phase Values
- To indicate that a curve references phase values, phase curves have the letter p at the end. For example, pmwnco.vectorp.
- Magnitude Values
- To indicate that a curve references magnitude values, magnitude curves have the letter m at the end. For example, pmwnco.vectorm.
- Real Curves
- Real curves that reference real values have the letter r at the end, pmwnco.vectorr.
- Imaginary Curves
- Imaginary curves that reference imaginary values have the letter i at the end, pmwnco.vectori.