Micro Dialogs
Allows you to set default parameters for XY plots.
Micro dialogs contain a subset of the most common functions performed in HyperGraph 2D. To access a micro dialog, double-click on a plot element to
display the micro-dialog at that location. For example, if you want to modify the
header properties, double-click on the header to display the micro dialog at that
location. Micro dialogs are available only for the XY Plot type.
Note: To display
micro dialogs on Linux and Mac platforms, you must right-click on the plot
element (axis, curve, datum line, and legend) and select
Properties from the context-sensitive
menu.
Micro-dialogs are available for the following plot elements:
Axis
Select from the following options to change the plot axis' appearance.
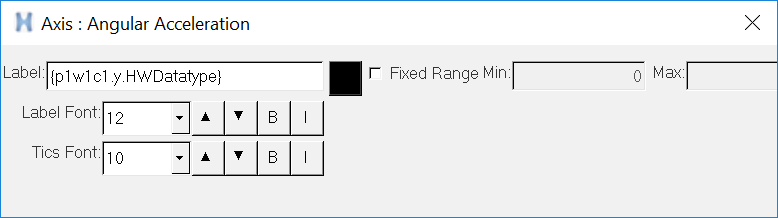
Figure 1.
- Label
- Displays the Axis label. You can edit the label directly by clicking in this field.
- Label Font
- Select the label's font size from the drop-down menu. You can also use the up and down arrow buttons to incrementally change the font size by one point. In addition, click B or I to apply bold or italic styles to the axis label.
- Tics Font
- Select the tics' font size from the drop-down menu. You can also use the up and down arrow buttons to incrementally change the font size by one point. In addition, click B or I to apply bold or italic styles to the tics, respectively.
- Fixed Range
- Activating the Fixed Range check box activates the Min and Max fields and allows you to enter a fixed minimum and maximum range.
- Min and Max
- When a curve is constructed, the axes’ minimum and maximum values are set so that the curve fits in the window by default. When you select a different axis scale type, the minimum and maximum values automatically change. New minimum and maximum values can be specified in the Min and Max text boxes when Fixed Range is selected. Altering the minimum and maximum values for an axis scales the plot along that axis.
- Color
- Click the color box to change the axis text font color.
Curve
Select from the following options to change the curve's appearance.
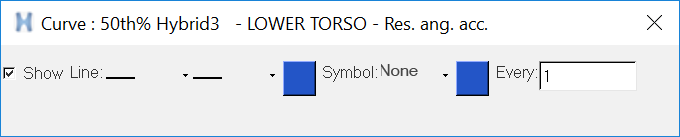
Figure 2.
- Show
- Deactivate Show to hide the curve from the plot window. Show is selected by default.
- Line Style and Thickness drop-down menus
- From the drop-down menus, select a curve line style and curve line thickness, respectively.
- Color
- Click the left-most color box to change the curve's color. Click the right-most color box to change the symbol color.
- Symbol
- Symbols can be placed on a curve to indicate data points. There are nine different symbols available. To mark the data points on the currently selected curves, select a symbol from the Symbol drop-down menu.
- Every
- By default, Every is set to 1 so symbols are placed at every data point. To change the symbol frequency, enter a number in the Every field. For example, if Every is set to 5, a symbol is placed at every fifth data point on the curve.
Datum Line
Select from the following options to change the datum line's appearance.
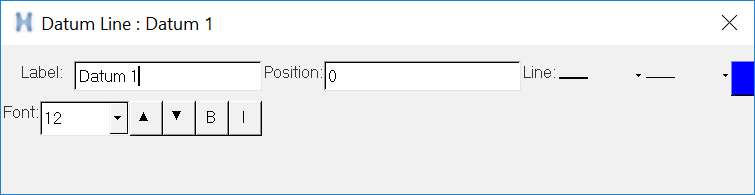
Figure 3.
- Label
- Enter a name for the datum label.
- Position
- Enter the coordinates for the datum line's position.
- Line Style and Line Thickness drop-down menus
- From the drop-down menus, select a curve line style and curve line thickness, respectively.
- Font Size
- Select the font size from the drop-down menu. You can also use the up and down arrow buttons to incrementally change the font size by one point.
- B, I
- Apply bold or italic styles to the curve name in the legend.
Legend
Select from the following options to change the legend's appearance.
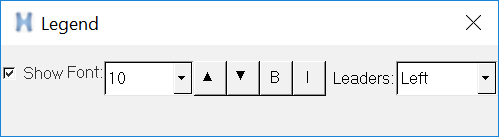
Figure 4.
- Hide
- Select Hide to hide the legend from the plot window.
- Font
- Select the font type from the Font drop-down menu.
- Font Size
- Select the font size from the drop-down menu. You can also use the up and down arrow buttons to incrementally change the font size by one point.
- B, I
- Apply bold or italic styles to the curve name in the legend.
- Leaders
- In the legend, a leader is displayed that reflects the line attributes of the curve.