uitable
Creates a table in a figure.
Syntax
h = uitable()
h = uitable(property, value, ...)
h = uitable(parent, property, value, ...)
Inputs
- parent
- Handle of a container object, which could be a figure, frame, uipanel, or uibuttongroup.
- property, value
-
- 'backgroundcolor'
- Specifies the background color. Valid values are 'transparent' or a real vector specifying RGB values in the range 0-255 or 0-1.
- 'celleditcallback'
- Callback function that is triggered when a value is changed in a cell in h.
- 'columneditable'
- Specifies the column(s) which are editable. Valid values are true(default), false, or matrix of size (1, n) where m is the number of column(s) with Boolean value(s) indicating which column(s) are editable.
- 'columnformat'
- Specifies the column formats. The value must be a cell,
specifying values of:
- 'char'(left justified data, default)
- 'numeric'(right justified data)
- [](default)
- 'columnname'
- Specifies the column labels of h. Valid values are 'numbered'(default) or cell with label names.
- 'columnwidth'
- Specifies the width of the columns. By default, the value is 'auto', where column widths are automatically adjusted. Individual column widths can be defined in a cell array of size (1, n), where n is the number of columns in 'data'. The values in each of the cells specify the width of the individual column(s).
- 'data'
- Table data. If the data type is cell, the cell elements can only be one of the following types scalar_int_bool_complex_string.
- 'enable'
- Specifies if h is enabled. Valid values are 'on'(default) and 'off'.
- 'fontangle'
- Specifies angle of the displayed font. Valid values are 'regular'(default) and 'italic'.
- 'fontname'
- Specifies name of the displayed font.
- 'fontsize'
- Specifies size of the displayed font.
- 'fontweight'
- Specifies weight of the displayed font. Valid values are 'normal'(default) and 'bold'.
- 'parent'
- Specifies the parent.
- 'position'
- Position and size of h. Value is specified as a vector of form: [left top width height]. If 'units' has a value of 'normalized', values must be between 0 to 1.
- 'rowheight'
- Specifies the height of the row(s). By default, the value is 'auto', where row height(s) are automatically adjusted. Individual row height(s) can be defined in a cell of size (1, n), where n is the number of row(s). The values in cell will specify the height for the individual row(s).
- 'rowname'
- Specifies the row labels of h. Valid values are 'numbered'(default) or cell with label names.
- 'tag'
- User-defined string to tag graphical control objects.
- 'tooltipstring'
- Tooltip to display.
- 'units'
- Specifies units of measurement. Valid values are 'pixels'(default) and 'normalized'. Value 'pixel' indicates that h has a fixed size and position specified by 'position'. Value 'normalized' indicates that h will be resized if parent is resized.
- 'userdata'
- User-defined numerical data.
- 'visible'
- Specifies if h is visible. Valid values are 'on'(default) and 'off'.
Outputs
- h
- Handle of the uitable.
Examples
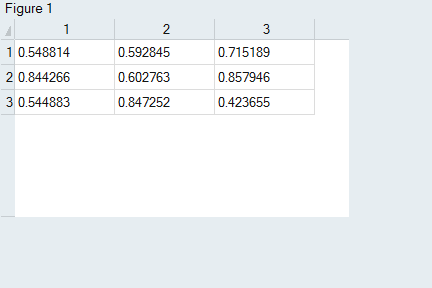
uitable('data', rand(3, 3));
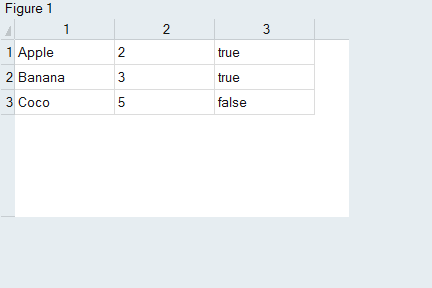
uitable('data', {'Apple',2,true;'Banana',3,true;'Coco',5,false});
h = uitable('data', rand(2, 3), 'columnwidth', {50, 100, 150}, 'columnname', {'col1', 'col2', 'sum'});function out = callbackfunc(h,callstate,argument1,argument2)
printf('In celledit callback, arg1 [%s], arg2 [%d]\n', argument1, argument2)
end
h = uitable('data', rand(2, 3), 'celleditcallback', {@callbackfunc, 'foo', 1});