polar
Creates a line plot in polar coordinates.
Syntax
h = polar(theta, rho)
h = polar(complex)
h = polar(..., fmt)
h = polar(hAxes, ...)
Inputs
- theta, rho
- Range of theta (angle) and rho (radius)
- complex
- Complex matrix which real part is used as theta data and imaginary part is used as rho data.
- fmt
- Formatting string for the curve. It can be any combination for the following
strings:
- line style: '-', '-.', ':', '--".
- line color: 'r', 'g', 'b', 'c', 'y', 'm', 'w', 'b'.
- marker style: 's', 'o', 'd', 'x', 'v', '^', '+', '*', '.'.
- hAxes
- Axis handle.
Outputs
- h
- Handle of the polar plot line graphics object.
Example
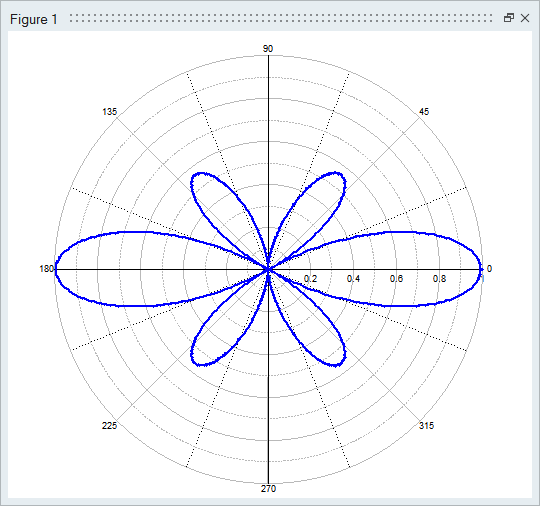
Polar plot example.
clf;
t = linspace(0,2*pi,1000);
r = cos(t+2*t).*cos(t);
polar(t,r)
Figure 1. Polar plot
Comments
If there is no axes, one will be created first. If a complex matrix (denoted by x) is given, the real part is used for theta and the imaginary part is used for rho.