Creates a textbox at coordinate x,y with text
't'.
Syntax
h = text(x, y, t)
h = text(..., property, value, ...)
Inputs
x,y
x,y coordinates for the textbox.
Type: double | integer
Dimension: scalar
t
Text to be added in the axes.
Type: string
Dimension: scalar
property
Properties that control the appearance or behavior of the graphics object.
Type: string
Dimension: scalar
value
Value of the properties.
Type: double | integer | string
Dimension: scalar
Outputs
h
Handle of the text graphics object.
Example
Simple textbox example:
clf
text(1,1,'hello world')
Figure 1. Simple text example
text example with alignment
properties:
clf;
scatter(1, 1);
t = text(1,1,'hello world', 'horizontalalignment','center', 'verticalalignment', 'top');
Figure 2. Text with horizontal and vertical alignment properties set
text example in a 3D plot:
clf;
x=[0:0.2:2*pi];
y=x;
z=sin(x')*cos(y);
s=surf(x, y, z);
t = text(10,90,'hello world');
Figure 3. Text in 3d plot
Comments
In 3D plots, the x and y coordinates are window
coordinates (a percentage of the window width and height). The reference point is the bottom
left corner of the window.
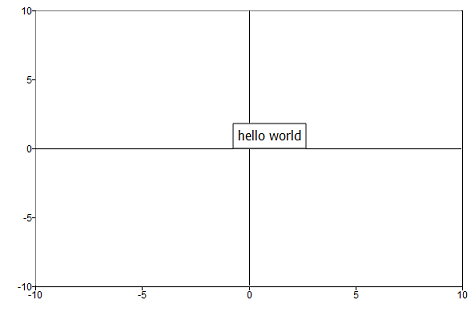
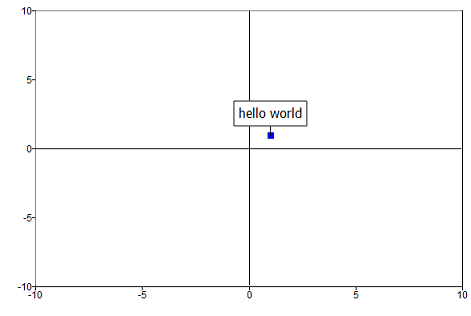 Figure 2. Text with horizontal and vertical alignment properties set
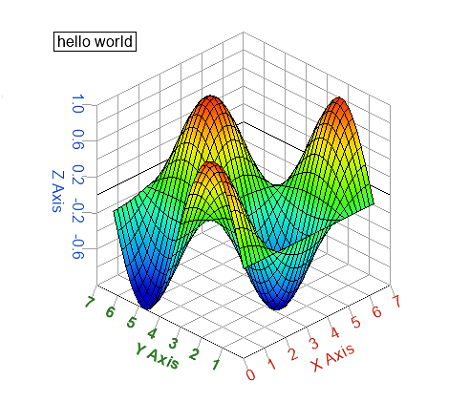 Figure 3. Text in 3d plot