MV-5010: Rigid Body Animation (Advanced)
Learn how to view force and moment vectors from a MotionSolve results file, use the collision detection feature, and use the measure panel to extract information from animation results.
View Force and Moment Graphics
Use HyperView to view the change in force and moment in the form of dynamic vectors that represent the magnitude and direction of the force and moment.
Copy all of the h3d files located in the
mbd_modeling\animation folder to your <working
directory>.
-
Click the
 (Vector) icon.
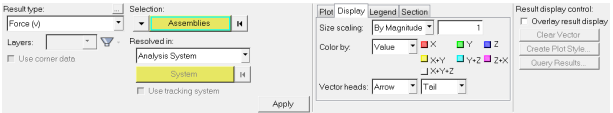
Figure 1. Vector panel -
Click the
 (Start/Pause Animation) button
to animate the results.
You will see an arrow whose size and direction change dynamically as the simulation is animated from start to end. This arrow represents the magnitude and direction of force on a body or at a joint as it is specified for force output in the model.
(Start/Pause Animation) button
to animate the results.
You will see an arrow whose size and direction change dynamically as the simulation is animated from start to end. This arrow represents the magnitude and direction of force on a body or at a joint as it is specified for force output in the model.
Use Collision Detection
View and detect collisions between bodies during simulations using HyperView.
-
On the Page Controls toolbar, click
 (Add Page).
-
Click
 (Load Results).
-
In the panel, click the Load model file browser
 and select collision.h3d from
your <working directory>.
and select collision.h3d from
your <working directory>.
-
Click the Load results file browser and select collision.h3d from
your <working directory>.
-
Click the (Start/Pause Animation) button
to animate the model.
-
After the file is read, press
 (Start/Pause Animation) button again to stop/pause the
animation.
(Start/Pause Animation) button again to stop/pause the
animation.
-
From the Tools toolbar, click the
 (Collision Detection)
button.
Tip: If this toolbar is not visible by default, go to the menu bar and select ).This will display the Collision Detection panel.
(Collision Detection)
button.
Tip: If this toolbar is not visible by default, go to the menu bar and select ).This will display the Collision Detection panel.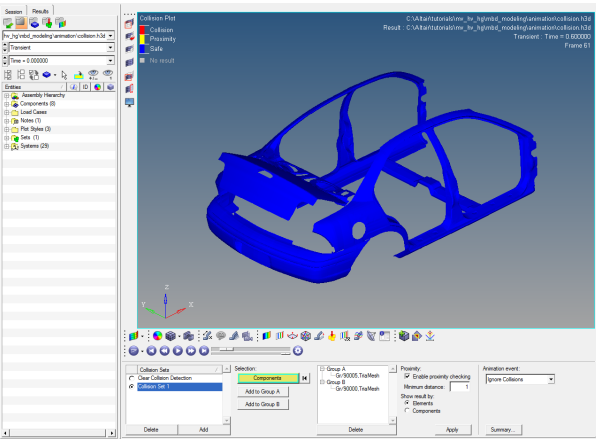
Figure 2. Collision Detection panel -
Click the (Start/Pause Animation) button
to animate the model.
The animation begins. Wherever areas of the trunklid collide with the trunk (car body), the colliding elements turn red. The color yellow indicates proximity. When neither proximity nor collision is detected, the bodies retain their natural colors.
Use the Measure Panel
Measure certain parameters during post-processing using HyperView.
-
On the Annotations toolbar, click the
 (Measure) panel button.
-
From the measure type pull-down menu, select
Position.
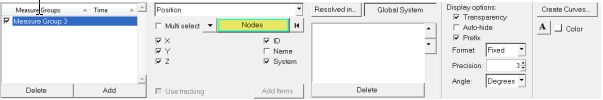
Figure 3. -
Click the Create Curves button.
The Create Curves dialog is displayed.
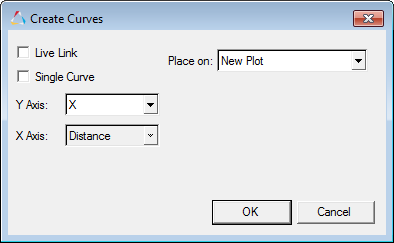
Figure 4. -
Click the (Start/Pause Animation) button
to animate the results.
You will see a marker on all the three plots which corresponding to the simulation time step in the HyperView window.