Adjust the legend range for the current active surface graph.
Cartesian surface graph data can be clamped between two values to help reveal changes in a
result that would be missed with the default range. The colouring of the result is changed
whereby blue corresponds to the minimum value and red to the maximum value.
On the Surface
contextual tabs set, on the Display tab, in the
Legends group, click the dialog launcher.
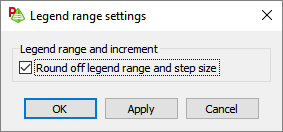
Figure 1. The Legend range settings dialog.
The following settings are available:
Round off legend range and step size
Data is often represented in a decimal form to represent a value accurately. The
number of digits after the decimal point could result in a legend range that is
difficult to read and interpret.
Select this option for a more legible legend
containing rounded off values. The original data range is contained within the rounded
off range.
 dialog launcher.