Drill Down to Nodes by Cluster or Queue
Drill-down to get node information about the nodes in a cluster, nodes attached to queue, or a subset of nodes in either of these categories filtered by a condition.
| Color | Condition | State |
|---|---|---|
| Red | requires attention | down, stale, state-unknown, unresolvable |
| Green | in use | job-busy, job-excl, resv-exclusive |
| Purple | unavailable | offline, provisioning, wait-provisioning |
| Yellow | available | free |
| Orange | idle | idle |
Drill Down to Node Details for an HPC Cluster
Drill-down to a get detailed information about the HPC cluster's nodes such as the state of the node, and the availability of CPUs and memory.
Drill-down for detailed node information for all cluster nodes or nodes in a specific condition.
-
Choose one of the following options:
- To view all HPC nodes, click the number under the Nodes column.
- To view nodes that are in a specific condition, click the appropriate colored area of the Status bar.
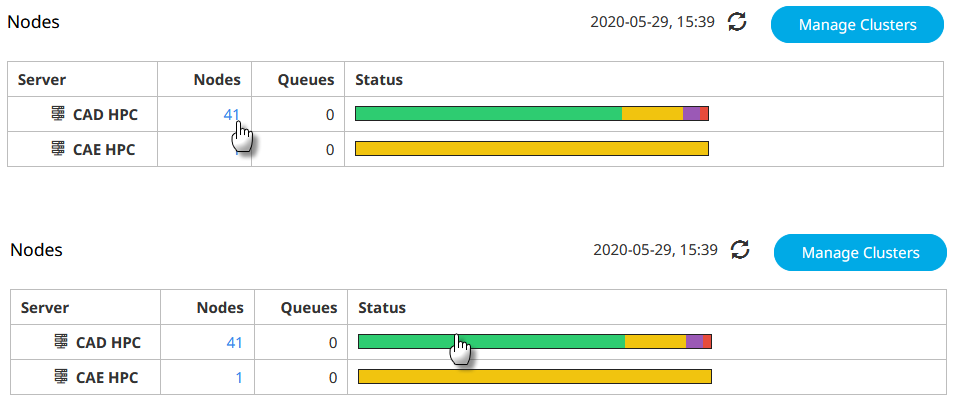
Figure 1. Drill-down to Node DetailsA list matching the selected filtering requirements is presented with each row representing a node.
Drill Down to Nodes Attached to a Queue
Drill-down to view node details of nodes that have been attached to a queue.
Drill-down to see all nodes that have been attached to a queue or nodes attached to a queue that are in a specific condition.
-
Choose one of the following options:
- To view all the nodes attached to that queue, click the number under the Nodes column.
- To view nodes attached to the queue nodes that are in a specific condition, click the appropriate colored area of the Status bar.
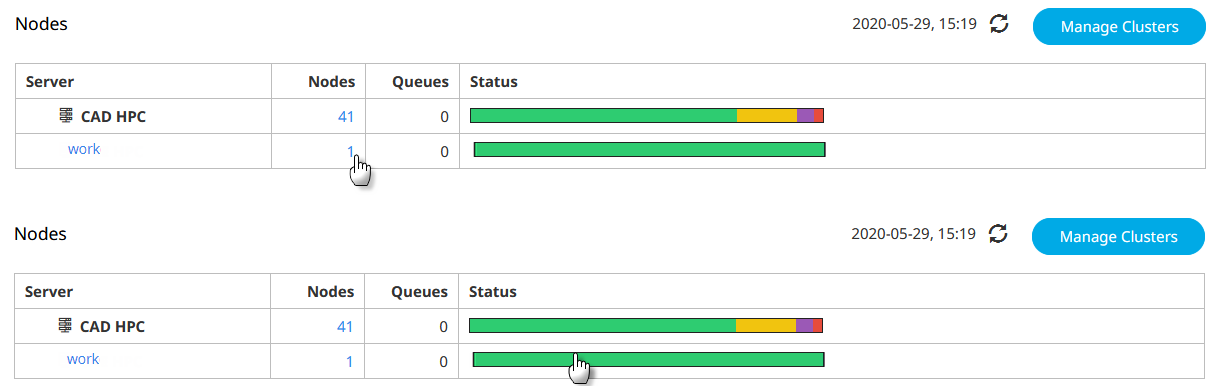
Figure 2. Drill-down to Nodes Attached to a QueueA list matching the selected filtering requirements is presented with each row representing a node.
Understand the Node Detail View
A detailed view of an HPC cluster's nodes including the state of the node and resource availability.
- the name of the node
- the state of the node
- number of CPUs being used / total number of CPUs present on the node
- amount of memory being used / total memory present on the node
- a comma separated list of the jobs running on the node in the format jobid/cpu_no where cpu_no identifies the CPU that is being used by the job. CPUs are numbered from 0 to n.
- comments added by the WLM administrator or the WLM itself about the node
Presently, node management cannot be done at the vnode level, therefore you cannot select a vnode to take it offline or place it online.
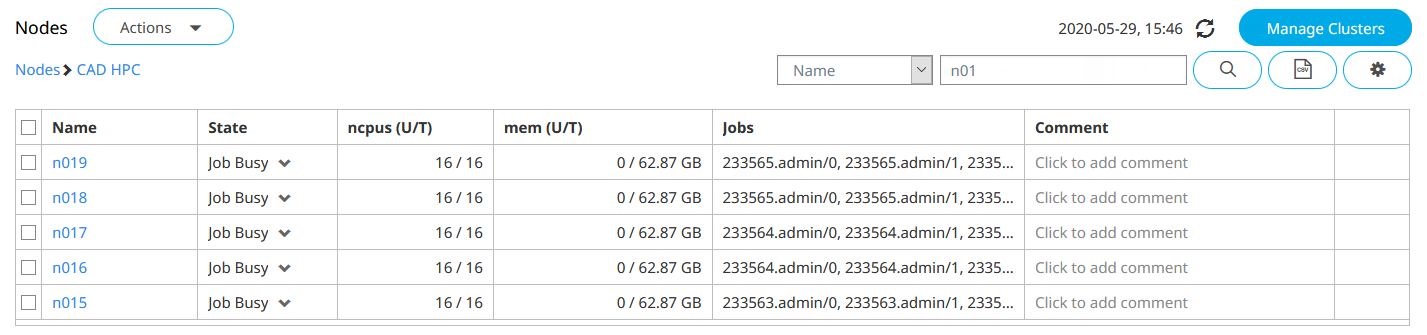
Figure 3. Node Details