Add Callouts to the Results
Call out and review values for a selected result type at points of interest on your model using the callout icons in the Analysis Explorer.
After running an analysis, click the Show Analysis Results icon. The Analysis Explorer appears to the right of the model.
-
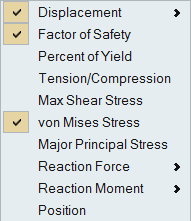
To create a callout at a point of interest, click
 in the Analysis Explorer, select a
Result Type, and then click a point on your model.
Box-select to see the maximum value in an area.
Note: The callout value applies to the currently selected run and load case.
in the Analysis Explorer, select a
Result Type, and then click a point on your model.
Box-select to see the maximum value in an area.
Note: The callout value applies to the currently selected run and load case. -
To automatically create callouts showing where the minimum and maximum values
occur for a result type, select a Result Type, and then
click
 .
Note: When you select Factor of Safety for the result type, the minimum is shown.
.
Note: When you select Factor of Safety for the result type, the minimum is shown. - Optional:
To display callouts in a table, click
 in the Analysis Explorer.
Each callout is specific to a selected run
and load case.
in the Analysis Explorer.
Each callout is specific to a selected run
and load case.
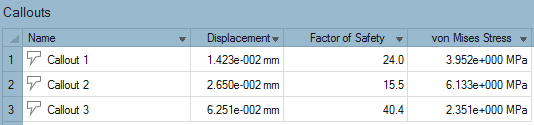
- Selecting a row in the table also selects the callout in the modeling window.
- To show or hide a single callout, in the Callouts table, Name column,
click
 .
. - To show or hide all callouts, in the Analysis Explorer, click .
- To sort the order of a column in the table, click the column header. Or
you can click
 or
or  to select Sort
Ascending or Sort Descending.
to select Sort
Ascending or Sort Descending.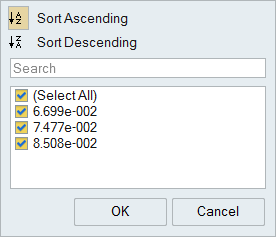
- To add or delete columns on the table, right-click a column header, and
then select or deselect a property.