Path Visualization
Show the possible information flow on paths between the nodes of the network with the Path Visualization Tool.
The path visualization tool can be started by selecting from the Analysis menu, or by pressing the corresponding button on the Analysis toolbar. After selecting one or multiple nodes, paths originating at these nodes will be displayed. There are several drawing and display options for connectivity path data available, which can be changed on the Display tab of the Settings dialog. If no paths are available for the selected nodes, a corresponding message will be displayed in the Output View. To exit the Path Visualization Tool, select from the Analysis menu or the corresponding button on the Analysis toolbar has to be selected again.
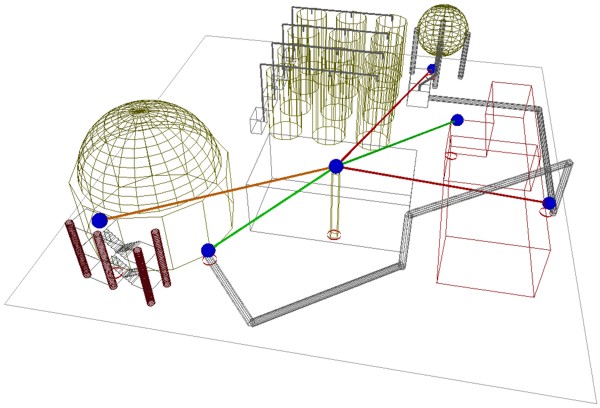
Figure 1. Example of the path visualization tool.