Creating a Summary
A summary tabulates information for selected fields and presents the results in a one or two dimensional matrix. The most basic summary requires a single key field and a single measure. However, you can create summary reports that include multiple key fields and multiple measures. You can also include item fields to display individual transactions and you can designate a filter to apply when displaying the summary. A host of display options lets you sort the summary, add subtotals, and format your summary report for easier viewing.
The following procedure teaches you the basics of creating a summary: adding key fields, measures, and item fields and selecting a filter to apply when the summary displays. Summary display options are discussed in separate sections that follow.
Note that when you are creating several similar summaries you can save time by using the first definition as the starting point for subsequent definitions. Refer to Duplicating Summaries for details.
Defining and naming the summary
Steps:
-
Go to Summary Design.
-
Select Add Summary from the Summary Design ribbon. The Summary Window appears.
-
Name the summary, and then select the green check icon
 to accept.
Name the summary by entering an appropriate name in the Name box. Note: Summary names must adhere to Monarch Classic's long naming conventions. If you do not provide a name, Monarch Classic will attempt to name the summary using the name of the first measure you specified. If this name is already in use, you will be prompted to enter a name.
Setting general properties
Steps:
-
Apply a filter.
-
No Filter option: Select this option to turn off filtering for the summary. The summary is built using all records. This option, like the previous option, overrides any filter that you may have applied in the Table window.
-
Default Filter option: Select this option to apply the filter that is currently applied to the Table window. This option uses only the records that are available to the Table window at the time the summary is built. If you switch the filter that is applied to the Table window or modify its definition, the summary is recalculated to reflect the changes.
-
To alter the summary's Default text or Title row styles, click the Edit button beside Default style or Title row style to display the Color Properties dialog.
-
If you want the summary to contain a total line field, select the Insert Total Line check box, and enter a name for the total line field in the Label box.
Note: You may alter the default text color and formatting settings for the total line field by clicking the Edit button next to the Style field.
-
To add a label, enter text in the Label box. To set the label style, click the Edit button under Label to display the Color Properties dialog.
-
If you chose to insert a total line, you can specify the number of blank lines, if any, that you want inserted before the total line.
From the Apply Filter drop-down menu, select a filter to apply when creating and displaying the summary (or select No Filter if you don't want to apply one).
When you create a summary definition, you may assign a filter to limit the records available to the summary. The Apply Filter To Records box provides several filtering options. Use the drop-down list to view a list of the available filters and options.
Select a filter name to apply a specific filter when building the summary. The filter you select is applied to the data only for the purpose of building the summary; it is not applied to the Table window and it does not limit the data available to other summaries.
When building and displaying the summary, the filter overrides any filter that you may have applied in the Table window; it is not applied along with the active table filter. If the selected filter is subsequently modified, the summary will be recalculated. If the filter definition is deleted or invalidated, the Summary definition is modified to use the No filter option.
Setting summary fields
Steps:
-
Select Add/Remove Fields from the Summary Design ribbon.
-
To add each key field to the summary definition, select a field from the Table Field list and then select the Add Key button. The field is moved from the Table Field list to the Key Field list on the right.
-
To add each Item field to the summary definition, select a field from the Table Field list and then select the Add Item button. The field is moved from the Table Field list to the Item Field list on the right.
-
To add each Measure field to the summary definition, select the Add Measure button. The field is moved from the Key Field list to the Measure Field list on the right.
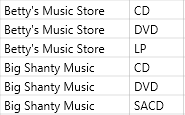
Key fields are used to generate the summary matrix. You select the fields that you want to tabulate, such as all customers or all product types in the order that you want to break out the field values. For each key field, Monarch Classic produces a list of all values found within the field. The values are then combined with values from other key fields to create each line in the summary. For example, a Customer field with the values "Betty's Music Store" and "Big Shanty Records" and a Media field with the values CD, DVD, LP and SACD will produce six summary lines, as shown in the illustration below.

Summary lines created using Customer and Media as key fields.
In this example, the Customer field is the first key and the Media field is the second key. The resulting summary will break out each media type within each customer.
If you want to remove a Key field, select the field from the Key Field list and select Remove Key.
If you want to change the order in which Key fields are displayed, select the field from the Key Field list and select Move Up or Move Down (at the top of the Key Field list).
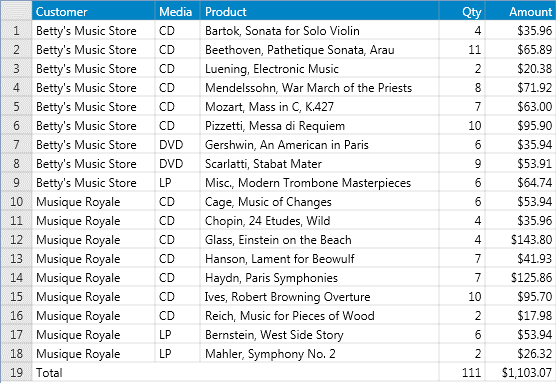
Item fields are used to display data in its original form. Use item fields to break out and display individual transactions.

Summary created using Product field to break out individual sales transactions.
If you want to remove an Item field, select the field from the Item Field list and select Remove Item.
If you want to change the order in which Item fields are displayed, select the field from the Item Field list and select Move Up or Move Down (at the top of the Item Field list).
Typically a summary would include at least one measure.
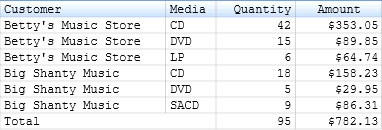
Measures are numeric fields you want to tabulate for each set of key field values. Using the example above, you might want to tabulate quantities sold or total sales for each media type within each customer. To do this, you would select the Quantity field or the Amount field. To display both quantities and totals sales, you can select both the Quantity and Amount fields as measures.

Summary created using Quantity and Amount fields as measures.
If you want to remove a Measure field, select the field from the Measure Field list and select Remove Measure.
If you want to change the order in which Measure fields are displayed, select the field from the Measure Field list and select Move Up or Move Down (at the top of the Key Field list).
Defining page setup
To specify print options for the summary, select Page Setup from the Summary Design ribbon. play the Summary Page Setup Window. This window enables you to add a page header or footer to the summary, as well as specify margins and other print options for the summary. For more information see Setting Margins and Print Options.
Building and displaying the summary
To build and display the summary, choose Accept. (To exit without building the summary, choose Cancel.)
Monarch Classic builds the summary and displays it in a separate summary window.
Note: Monarch Classic includes a number of options that you may use to sort a summary, add subtotals and format the summary for easier viewing. These options are discussed in the following pages:


