


|
Overview: Summaries
The Summary window is used to create an analysis of your data, called a summary report, or simply a summary. A summary tabulates information for selected fields and presents the results in a one- or two-dimensional matrix. For example, the summaries below show sales totals for a fictional distributor of classical music recordings, first broken down by customer, then by media type.
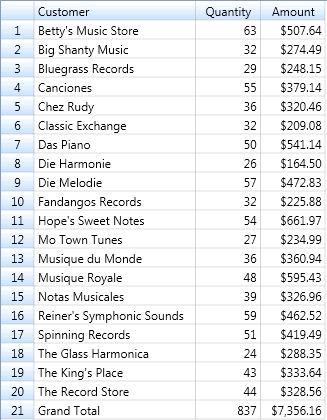
Figure 1. Sales totals by customer.
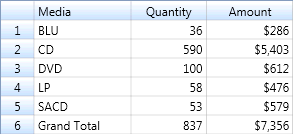
Figure 2. Sales totals by media type.
These summaries tabulate information about a single key field. In the first summary, the key field is Customer, in the second, the key field is Media. The field that is tabulated (or summed) is called a measure. In each of the summaries shown above, the Amount field is used as the measure.
Note: A summary must include at least one key field. A summary typically includes at least one measure, but a measure is not always required.
Key fields are used to define the summary matrix. For example, the summary in Figure 2 uses the Media field as the key field. Monarch Classic examines the field, creates a list of all unique values (BLU, CD, LP, SACD, and DVD), and then uses these values to create the summary matrix.
Measures are numeric fields that are tabulated for each unique set of values found in the key fields. For example, in Figure 2, the Amount field is broken down into separate totals for each type of recording media.
Although only a single key field and a single measure are required to create a summary, a summary may be quite complex, including multiple key fields and measures. Each measure can be used to calculate the sum, average, percent of total, minimum, maximum, standard deviation, or variance values for each key. Monarch Classic also provides a COUNT function that can be used as a measure. Rather than performing a calculation on a selected measure, the COUNT function counts the number of records for each key.
The summary in Figure 3 includes the Customer and Media fields as key fields, the COUNT function, and the Amount field as a measure. Separate columns are created to show the total sales amounts and the average sales amounts.
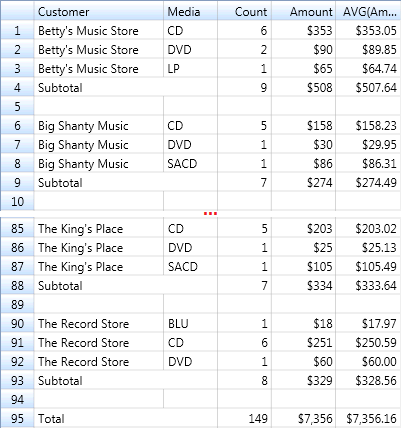
Figure 3. Sales broken down by customer and media type. The COUNT column displays the number of transactions and the Amount columns display the total dollar sales and average sale for each key.
A summary can also include item fields that expand a summary to show individual transactions. Item fields provide an advantage over viewing individual transactions in the Table window because you can use the summary to display subtotals and grand totals.
The summary in Figure 4 includes the Customer and Media fields as key fields and the Quantity and Product fields as item fields. This summary displays individual transactions for each media type within each customer. Subtotals are generated at both the Media level and the Customer level.
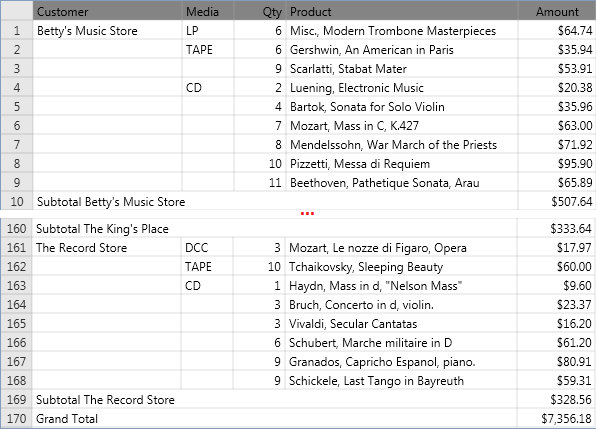
Figure 4. Item fields are used to display individual transactions.
Each of the summaries shown above displays key field values in columns at the left side of the summary. Another type of summary, sometimes referred to as a crosstab summary, displays summarized information about two key fields in a two-dimensional matrix. The values for one key field are displayed down the leftmost column of the matrix and the values for the other key field are displayed across the top row. This two-dimensional arrangement displays only a single measure at a time and cannot include item fields.
An example of this type of summary is shown in Figure 5. The Customer and Media fields are the key fields, and the Media field values are spread across the top row. The Amount field is broken down into separate totals for each type of recording media. Grand totals for each store are displayed in the rightmost column and grand totals for each media type are displayed along the bottom row. The bottom right cell shows the grand total for all media types sold to all stores.
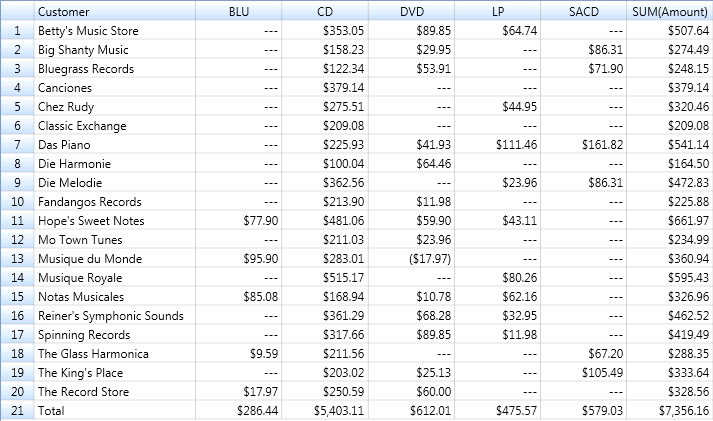
Figure 5. A two dimensional (crosstab) summary showing sales broken out by customer and media type.
In this example, the first summary cell (upper left) displays the total of the Amount field for all records where the Customer field contains "Betty's Music Store" and the Media field contains "CD". The cell to its right displays the total of the Amount field for all records where the Customer field contains "Betty's Music Store" and the Media field contains "DCC", and so on.
See Creating a Summary for additional information.