


|
Specifying Matching Key Values for a Summary
When Monarch Classic builds a summary, it generates a list of all unique values found in each key field. These lists are combined to form the summary matrix. Each line in the summary matrix represents a set of unique key values. For example, in the following summary, the fields Customer and Media are used. The Customer field contains 20 unique values, one for each customer in the report. The Media field contains 5 unique values, one for each media type in the report. In combination, these two fields can create a summary matrix of up to 100 lines, (20 customers * 5 media types). In practice, the summary would likely contain fewer lines, since not all media types are present for each customer (see illustration below).
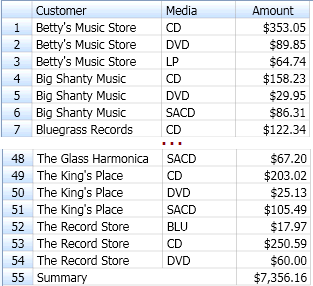
Summary matrix created for
20 customers and five media types.
Sometimes you may be interested only in a subset of the values for a key field. To do this, you could create a filter that limits the records available to the summary. Although quite powerful, filters by themselves do not provide some of the capabilities required for some of the more sophisticated analyses you might want to perform.
To augment the capabilities provided by a filter, Monarch Classic’s summary building engine provides several options that you can use to specify which key values to use. These options are located under the Matching sub-tab for the Key.
Steps:
-
Go to Summary Design.
-
Select a Summary from the Summaries selector. The Summary's properties are displayed on the Summary Window.
-
Select Keys from the Summary Design ribbon.
-
Select a key field from the fields selector to display that field's tabs and properties.
-
Go to the Matching tab.
-
Select the radio button of the appropriate Match option.
-
Select All Values to build the summary using all key field values.
-
Select First N Values to build the summary using the first n values in the key field (based upon the sort order applied when the summary is built).
-
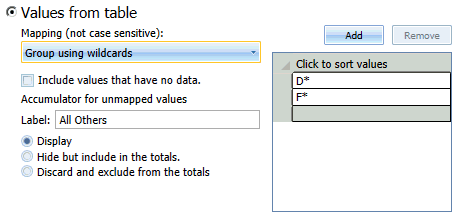
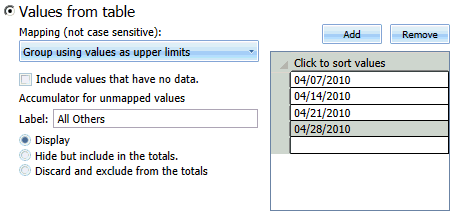
Select Values from table to create a list of specific values that Monarch Classic will use for each key field, as well as specify the mapping of the values to that list.
-
Select Measure Limit to build the summary using only those key field values for which a selected measure subtotal falls above or below a specified limit. Select the measure from the associated drop down list, then select a comparison operator and enter a limit value in the adjacent box.
-
Select Time Interval to build the summary using only those key field values that fall within the specified time interval.
-
Enter a label for all other values (optional).
-
For First N values, Values from table, and Measure Limit, enter the values to use.
-
Select a value and then click Add.
-
Enter a value directly on a row on the panel at the right.
-
Select a value on the panel at the right and select Remove.
-
Click Finish to complete the Add operation.
-
Select Accept.
These options are described in detail below.
When selecting First N Values, Values from table, or Measure limit, you also have the option of grouping all other values under a single label that appears in the summary. This feature can be useful when breaking out specific key field values that you want to compare against the entire data set.
When the summary is built, all data associated with key field values or ranges other than those you entered in the Values box will be accumulated under the label and displayed as a separate line in the summary.
You may edit the Accumulator label (the default is All Others) to make it more descriptive if you like.
If you selected the Values from table option, select the Add button to display the key values box:
You can:
If you selected the Upper Limit Values option, use the New Value button to add each upper limit value to the Specified or Upper Limit Values list, then click OK to close the dialog.
Monarch Classic re-displays the summary using only the values you specified.
First n Values
This option displays the first n values available to the summary (where n is a number that you specify). Sorting the summary can change the values that are returned. For example, this option can be used along with the Measure sorting option (see Sorting Key and Item Fields in a Summary) to create a Top n analysis of your data (see illustration below).
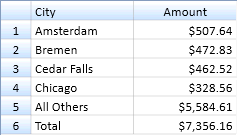
Using First n Values to create an analysis showing the top four sales cities. The City field is sorted in descending order according to the Amount (in sales) measure.
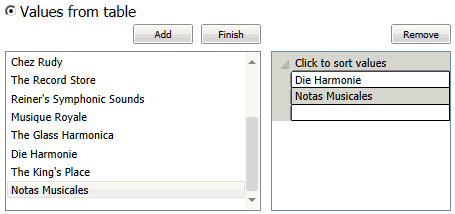
Values from Table
With this option you can create a list of specific values that Monarch Classic will use for each key field, as well as specify the mapping of the values to that list.
The list can be as simple as "CD", "DVD" and "LP", or it can be more complex, involving the standard ? and * wildcards.
Note: Wildcards are not allowed for date or numeric values.
Another use of the Specified Values option is to create a specific sort order for the key values. Monarch Classic allows you to sort by key fields or measures, but the order is ascending or descending, either alphabetic or numeric, depending on the field type. There are some cases where you want to define the sort order exactly, for example with months of the year.
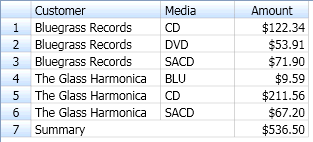
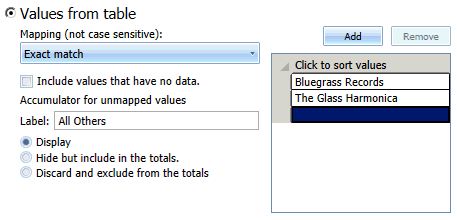
Using specified values to display information for only two customers (Bluegrass Records and The Glass Harmonica).
Within Values from table, you have three mapping choices:
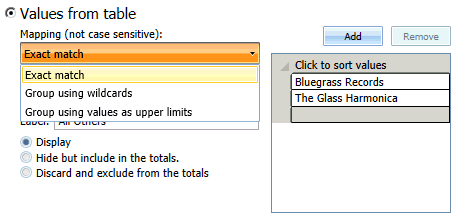
Exact Match
Using Exact match, you only group according to the key values that are listed. In the example above, you only group according to the four customers listed.
Group using wildcards
Group using wildcards works almost like Exact match, but in this case you can use wildcard characters to specify the key values to include. In this way you do not have to enter all values exactly.
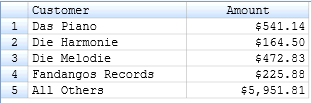
In this example, we specify to group only according to Customers that start with D and F:
And we get a summary like this:
Group using values as upper limits
For key fields that contain date or numeric values, a somewhat different type of list might be desirable. For dates and numbers, you can create a series of ranges by specifying the upper limit for each range (e.g., 100, 200, 300 or 04/07/2010, 04/14/2010, 04/21/2010, etc.).
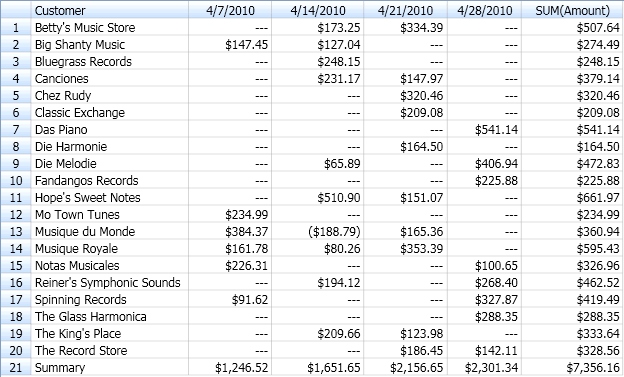
Using upper limit values to group Ship_date values into weekly ranges.
Measure Limit
This option displays only those key field values for which a selected measure subtotal falls above or below a specified limit. For example, you might use this feature to display only those sales regions where total sales exceed 80,000.
Time Interval
This option is enabled only when the key field is of type date/time. When this option is selected, the read-only edit box on the right lists the time intervals which span the range of date/time values currently present for the key field as filtered by the summary’s applicable filter. This is precisely the range that will be applied when the summary is actually computed.