Turbulent Flow Through a Wavy Channel
In this application, AcuSolve is used to simulate turbulent flow through a channel with a lower wall shaped as a sinusoidal wave. AcuSolve results are compared with experimental results adapted from Kuzan (1986). The close agreement of AcuSolve results with experimental results validates the ability of AcuSolve to model cases with internal flow through a channel with wavy walls.
Problem Description
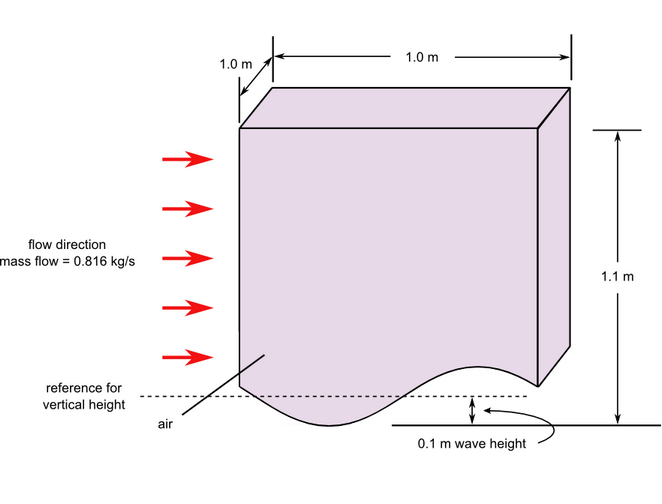
Figure 1. Critical Dimensions and Parameters for Simulating Turbulent Flow Through a Wavy Channel
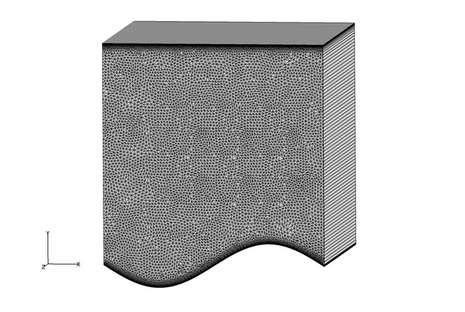
Figure 2. Mesh Used for Simulating Turbulent Flow Through a Wavy Channel
AcuSolve Results
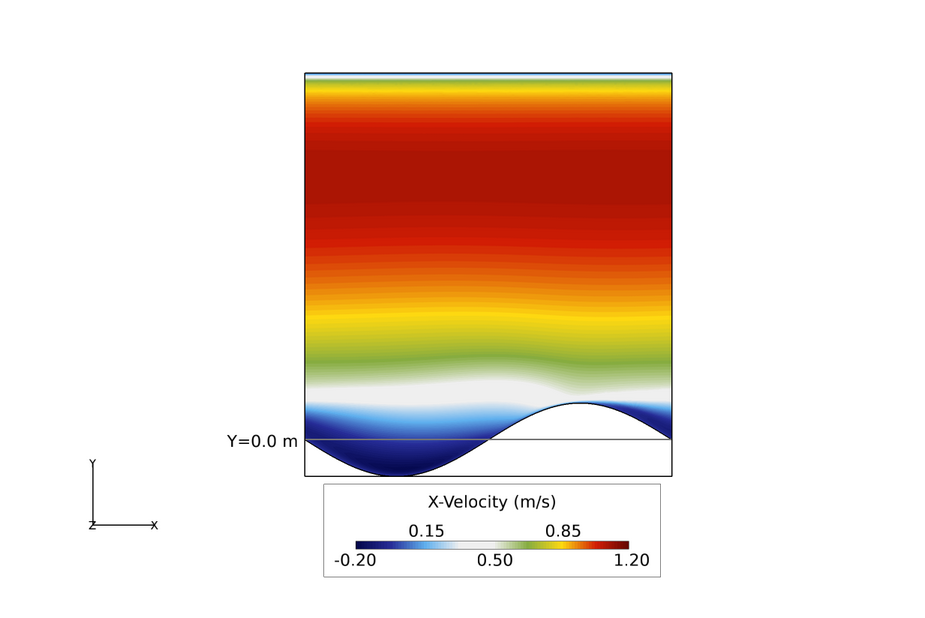
Figure 3. Velocity Contours in the X-Y Plane in a Wavy Channel (the Horizontal Line Represents the Reference for Wave Height - the Wave Crest is 0.1 m Above The Reference Height, and the Wave Valley is 0.1 m Below the Reference Height)
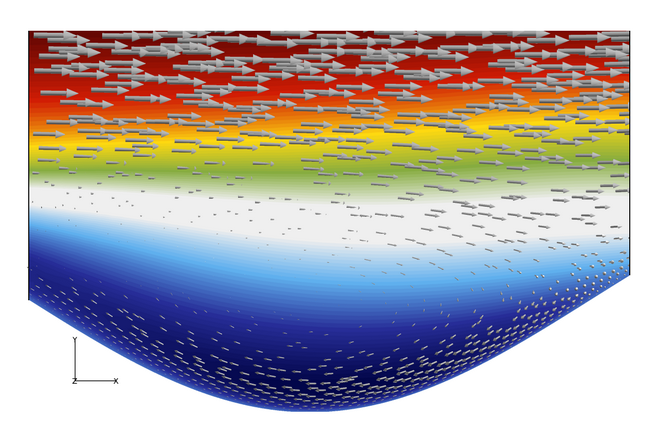
Figure 4. Close-Up View of Velocity Contours and Velocity Vectors in the X-Y Plane Near the Valley of a Wave

Figure 5. X-Velocity Plotted Against Vertical Location in the Channel Above the Valley Center (the Valley Floor is 0.1 m Below the Reference Height)
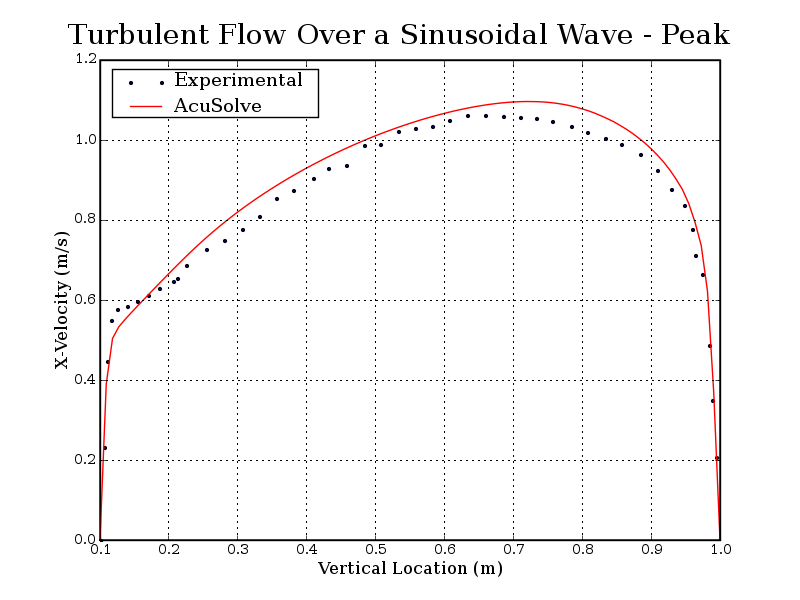
Figure 6. X-Velocity Plotted Against Vertical Location in the Channel Above the Wave Peak (the Wave Peak is 0.1 m Above the Reference Height)
Summary
The AcuSolve results compare well with the experimental data for X-velocity in a channel with a wavy floor. In this application, the flow is driven with a constant mass flow rate and periodic constraints are used to model a repeating array of channel segments with a wavy bottom wall. Separation of the flow occurs as a result of the adverse pressure gradient created by the changes in area. This leads to recirculation within the wave valleys. The flow separation occurs along the smoothly tapered wave wall, illustrating the ability of AcuSolve to accurately predict the separation point in this type of application. The X-velocity predicted by AcuSolve matches the experimental results with an overall coefficient of determination (R2) of 0.99 for each location shown in the plots.
Simulation Settings for Turbulent Flow Through a Wavy Channel
AcuConsole database file: <your working directory>\wavy_channel_turbulent\wavy_channel_turbulent.acs
Global
- Problem Description
- Analysis type - Steady State
- Turbulence equation - Spalart Allmaras
- Auto Solution Strategy
- Relaxation factor - 0.4
- Material Model
- Air
- Density - 1.0 kg/m3
- Viscosity - 0.0001 kg/m-sec
Model
- Air
- Volumes
- Fluid
- Element Set
- Material model - Air
- Element Set
- Fluid
- Surfaces
- Max_X
- Simple Boundary Condition - (disabled to allow for periodic conditions to be set)
- Max_Y
- Simple Boundary Condition
- Type - Wall
- Simple Boundary Condition
- Max_Z
- Simple Boundary Condition - (disabled to allow for periodic conditions to be set)
- Min_X
- Simple Boundary Condition - (disabled to allow for periodic conditions to be set)
- Advanced Options
- Integrated Boundary Conditions
- Mass Flux
- Type - Constant
- Constant value - -0.816 kg/sec
- Mass Flux
- Integrated Boundary Conditions
- Min_Y
- Simple Boundary Condition
- Type - Wall
- Simple Boundary Condition
- Min_Z
- Simple Boundary Condition - (disabled to allow for periodic conditions to be set)
- Max_X
- Periodics
- Periodic-Crossflow
- Periodic Boundary Condition
- Type - Periodic
- Periodic Boundary Condition
- Periodic-Streamwise
- Periodic Boundary Condition
- Type - Periodic
- Individual Periodic BCs
- Velocity
- Type - Periodic
- Pressure
- Type - Single Unknown Offset
- Eddy Viscosity
- Type - Periodic
- Velocity
- Periodic Boundary Condition
- Periodic-Crossflow
References
J. D. Kuzan."Velocity Measurements for Turbulent Separated and Near-Separated Flows Over Solid Waves". Ph.D. thesis. Deptartment of Chemical Engineering. University of Illinois. University of Illinois. Urbana, IL. 1986