AcuSolve Validation Manual
Collection of AcuSolve simulation cases for which results are compared against analytical or experimental results to demonstrate the accuracy of AcuSolve results.
The accuracy of the solutions presented in this document validates the capability of AcuSolve to simulate complex flow for a variety of problems. The goal is to provide accurate results for each validation case. Grid sensitivity studies have been performed, however, the simulation settings have not been optimized to minimize computation time. Instead, the cases presented are intended to portray settings that show a good trade off between accuracy and compute time.
Supporting database files (*.acs and *.hm for AcuConsole and HyperMesh, respectively) are available for the validation cases in a compressed .zip archive, validation.zip, in the \model_files\validation directory of your AcuSolve installation. Copy validation.zip to a working directory, then expand it for access to individual database files. These can be used to recreate the results for a particular validation case or can be examined to see the AcuSolve settings in detail.
- Problem Description
- A description of the geometry, physical properties, and specific AcuSolve modeling strategy.
- AcuSolve Results
- Results obtained from the AcuSolve simulation compared against theoretical or experimental results.
- Summary
- A summary of the validation case.
- Simulation Settings
- AcuSolve settings for the specific validation case and the name and location of the associated database file.
- References
- Sources of theoretical equations or experimental results.
AcuSolve Results Presentation
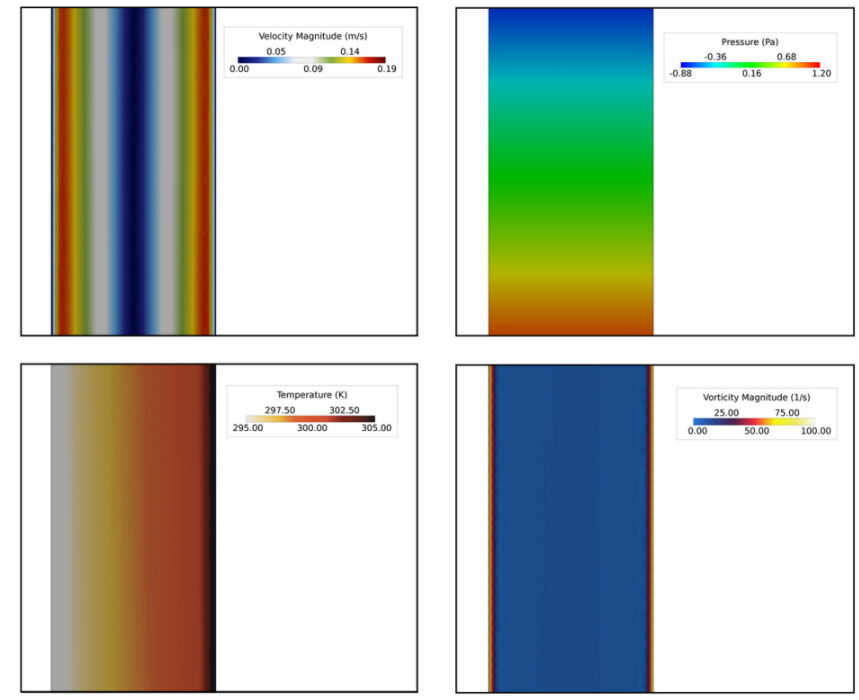
Figure 1.
Recreating the Results
- Start AcuConsole or HyperMesh and open the database file (*.acs or *.hm) for a particular validation case.
- Launch AcuSolve to generate a solution.
- Post-process results with AcuProbe, AcuTrans or AcuFieldView.
Typographical Conventions
Simulation settings are presented so that you can recreate the simulation case. The presentation of the simulation settings reflects the AcuSolve commands that are modified from default values. Labels in the GUI are indicated with highlighting, for example, Problem Description. Tree items that can be renamed are presented in normal font. Settings selected from a list are indicated after a dash. Settings that are entered directly into a field are indicated by courier font.
- Global
- Problem Description
- Analysis type
- Steady State
- Turbulence equation
- Laminar
- Global
- Material Model
- Gas
- Material Type - Fluid