2D element forces and moments are supported as tensors and can be plotted using the
Tensor panel in HyperView.
This functionality is only available for the .op2 file. Element force
and moment data is requested using the ELFORCE or FORCE case control command.
Element X-axis
In order to visualize element forces and moments with a proper sense of orientation, the
element x-axis must first be identified. Please refer to the CQUAD4/CTRIA3 documentation in
the Radioss, MotionSolve, and
OptiStruct Guide for more information on how to define the
element x-axis for 2D elements.
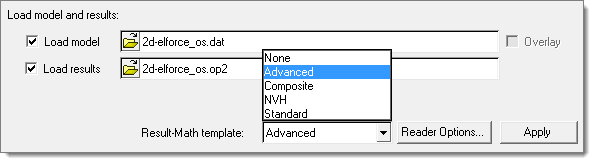
Load the model and results files with the Advanced Result-Math template in order to
visualize the element x-axis in HyperView.
Figure 1.
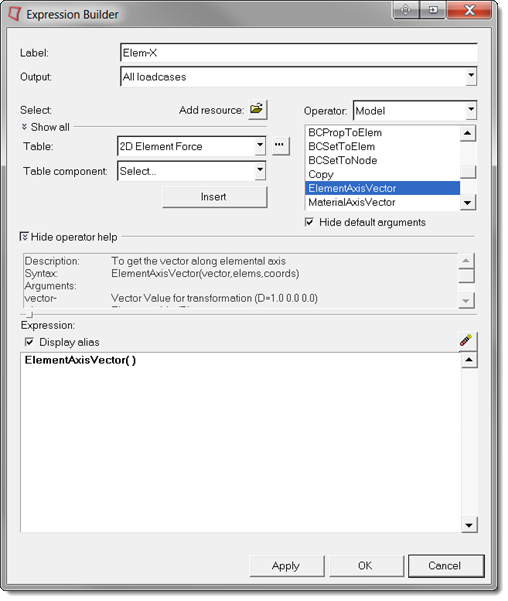
Once the results are loaded, the Derived Results icon will launch the Expression Builder allowing you to
define model or results-specific datatypes.
The Expression Builder is a graphical user interface which allows user-defined data type
expressions to be authored directly within HyperView. These
expressions use a simplified Templex-style syntax that gets parsed into XML statements which
are then passed on to Result Math for processing.
The element x-axis vector can be added to the list of datatypes by double clicking
ElementAxisVector from the Model Operator. Use a meaningful label so
this expression can be identified amongst the other vector datatypes while plotting.
Figure 2.
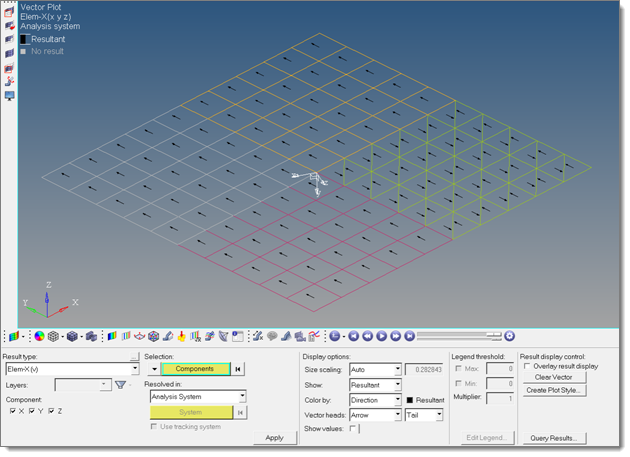
Below is a vector plot of each 2D element x-axis.
Figure 3.
When the element x-axis vector plot is overlaid on a force or moment tensor plot, the
positive and negative X, Y and XY values become clear.
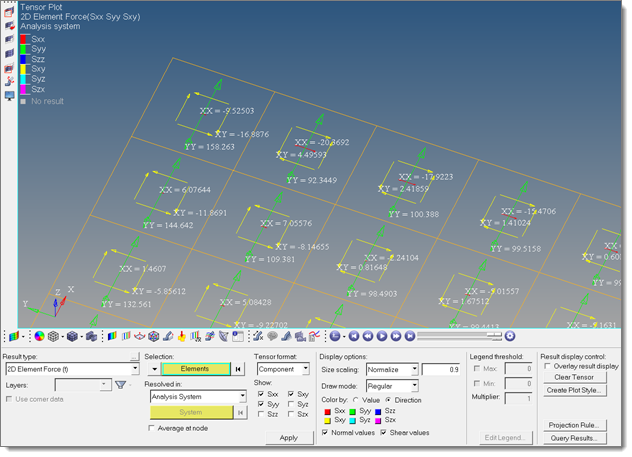
Forces
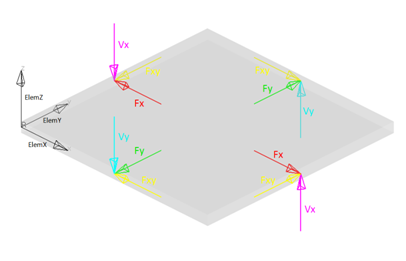
The image below shows the positive directions for element forces in a 2D element.
Fx and Fy are the normal forces acting on the x and y faces of the 2D element below
and are represented by the XX and YY components in the Regular drawing mode of the
tensor plot in HyperView.
Fxy is the in-plane shear force and is represented by the XY component in the Regular
drawing mode of the tensor plot in HyperView.
Vx and Vy are the transverse shear forces acting on the x and y faces of the 2D
element below and are represented by the ZX and YZ components in the Regular drawing
mode of the tensor plot in HyperView.
Figure 4.
Figure 5.
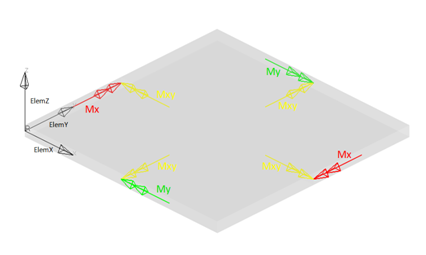
Moments
The image below shows the positive directions for element moments in a 2D element.
Mx and My are the bending moments acting on the x and y faces of the 2D element below
and are represented by the XX and YY components in the Moment drawing mode of the tensor
plot in HyperView.
Mxy is the twisting moment and is represented by the XY component in the Moment
drawing mode of the tensor plot in HyperView.
Figure 6. Figure 7.
Plotting Element Forces and Moments Using the Tensor Panel
There are a number of options in the tensor panel and since it is used to plot more than
just element forces and moments, some of the options are not meant to be used while plotting
forces and moments.
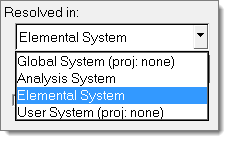
Resolved in
Element forces and moments are always written to the .op2 file in the elemental
system. If there is a material system defined on the 2D elements, and PARAM, OMID is
used, these forces and moments can be transformed and written to that system, but only
in an ASCII output.
Now that element forces and moments are read into HyperView as tensors they can be transformed from the elemental
system to any other system, even a system created on the fly in HyperView.
Figure 8.
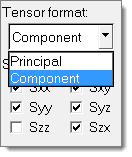
Tensor Format
The Tensor format should be set to Component. This allows any or all of the full
tensor components to be plotted. The Principal Tensor format is used for plotting
stress tensors.
Figure 9.
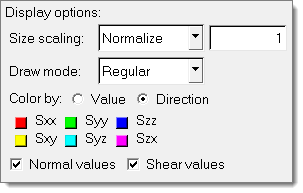
Display Options
Size scaling and color by options are rather straightforward. For clear results
normalize the tensor to a value of 1.0 or less. This will ensure that the tensor
drawings will not breech the elements’ edge.
There are two options available for the Draw mode: Regular and Moment.
Figure 10.
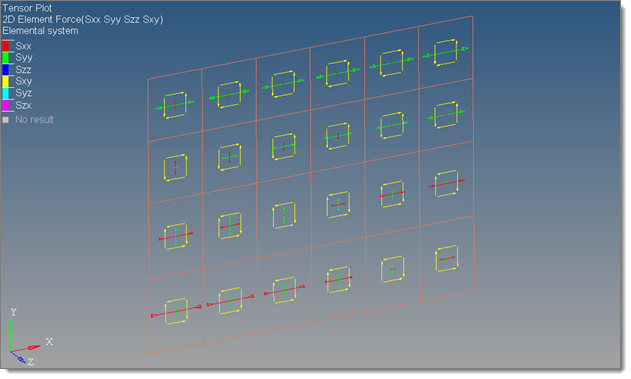
Draw mode: Regular
Regular drawing mode will plot a traditional full tensor for each element. This is
typically used for stress and element force tensor plots, and useful to properly
visualize tensor transformations.
Figure 11.
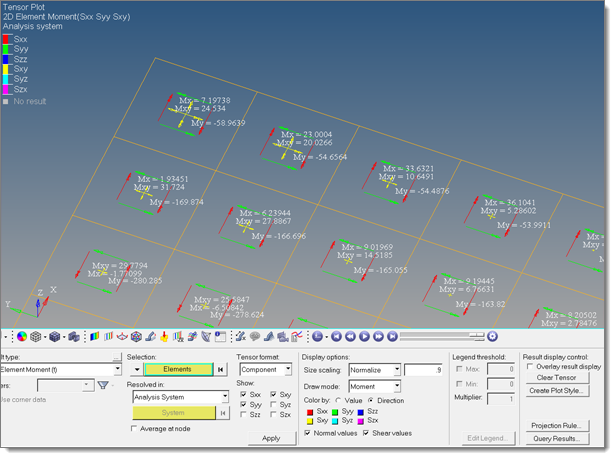
Draw mode: Moment
The Moment drawing mode was specially added to better conceptualize 2D element
moments. This mode isn’t useful for transformations, and only applies for element
moments, but it will allow you to better understand the physics behind the subcase
without needing an element reference guide. Please remember that the Regular drawing
mode can be used to visualize any tensor, including element moments, but the Moment
drawing mode was specifically designed for plotting element moments themselves.