Create a Path for Stress Linearization

  1. From the Extract-Linearize tab, click the Add new path icon to add a path to the table.
    Warning: Whenever a new path is added to the Path table/list, a warning icon will also be displayed in the table which indicates that it has not yet been defined.
  2. Select the start node of the path using one of the following methods.
    • Click the Node input collector and select By ID.
    • Pick an individual node directly from the model in the modeling window.
  3. Select the end node of the path using one of the following methods.
    • Click the Node input collector and select By ID.
    • Pick an individual node directly from the model in the modeling window.
    Note: Once the start and end nodes have been picked, a green check mark will be displayed in the Path table/list indicating that the path has now been defined.
    Tip: The Label, Num. Points, Review, and Color fields are editable. See the Manage a Path topic for additional information.
  4. From the Calculation portion of the tab, specify the stress tensor that will be used for stress linear calculation. Use the drop-down menu to select a stress type.
    • The default option is the first available stress tensor result type in the result file.
    • Use displayed contour will be displayed as an additional option provided that a contour of stress tensor exists. Choose this option if you want the averaging method and/or variation applied to the contour to be considered when calculating the linearized stresses.
    Note: Not all contour panel settings are relevant or will be considered for calculation when this option is used. A brief overview of the various settings is provided below:
    • Result type is considered if it is a stress tensor.
    • The Use corner data check box is considered.
    • The Use midside node results check box is not considered. Stress linearization will take into account mid-side node results if available.
    • Averaging methods: None, Simple, and Advanced are considered. Other averaging methods will be ignored and linearization calculation will proceed on the assumption that there is no averaging.
    • Variation is considered.
    • Advance Averaging options such as Average across component boundary or Feature angle averaging will not be considered.
    • All other contour panel settings are ignored.
  5. From the Plot portion of the tab, select from the following plot options: Extracted and Linearized Values or Linearized Values.
    1. Extracted and Linearized: This will plot tensor component data of both extracted and linearized stress (average membrane and membrane+bending) tensors.
    2. Linearized: This will plot tensor component data of only the linearized stress (average membrane and membrane+bending) tensors.
    Then select the stress components and invariants that will be plotted versus distance as an X-Y plot by activating/deactivating the appropriate check boxes.
    Stress linearization calculations will result in the generation of average membrane, bending, membrane + bending and peak stress tensors. This is in addition to the stress tensors that are extracted at each of the points along the line.
    For each component that is shown, the following will be plotted on the Y-axis with the distance of each point along the line on the X-axis:
    • The extracted stress component value at each point (Y-axis).
    • The average membrane stress component.
    • The membrane + bending stress component.
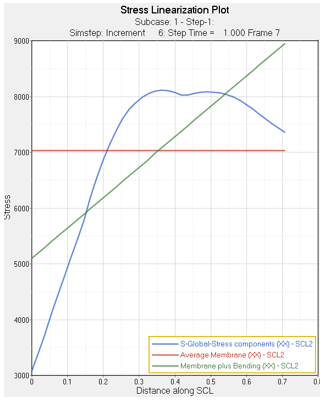

      Figure 1.
  6. Select a plot layout from the drop-down menu.
    Option Description
    One plot per line Creates one HyperGraph window for each selected path.
    One plot for all lines Creates one HyperGraph window for all selected path.
    Preview Plot Displays the plots for all selected paths in a preview window.
  7. Optional: Save the stress linearization report by activating the check box and browsing to the location that you would like to save the .csv file.
    The report is divided into five sections and contains the following information:
    • The model and result file that was used.
    • The line start and end node coordinates, stress contour settings, and the subcase/simulation step on which the calculation was performed.
    • A table showing the distance of each point from the start point in the first column and the extracted stress components at this point in the next six columns.
    • A table of the linearized stresses: average membrane, bending stress at start and end nodes membrane + bending stress at start and end nodes, and peak stress at start and end nodes.
    • The invariants – principals, vonMises, Tresca – for membrane, membrane + bending and peak stress.
  8. Click Apply.
    The selected paths are calculated and plotted. In addition a report is created if the Save Report option is selected.
    Note: Click the X (located at the top of the tab) to close the dialog.