Extract Data
Extract Data allows you to extract contour values at various points along a path on solid elements.
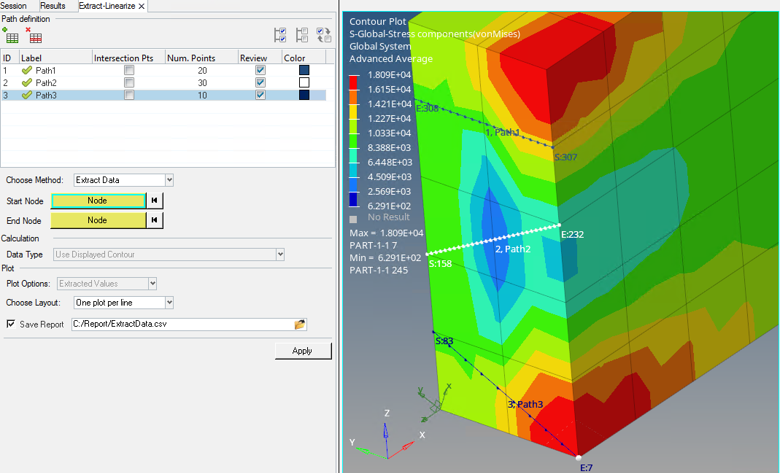
Figure 1.
Paths are defined at various locations in the model. The number of points that divide this line into equal segments is specified. The contour value is extracted at the points. The results can be viewed as a HyperGraph plot or exported to a comma separated values (*.csv) file.
Figure 2.
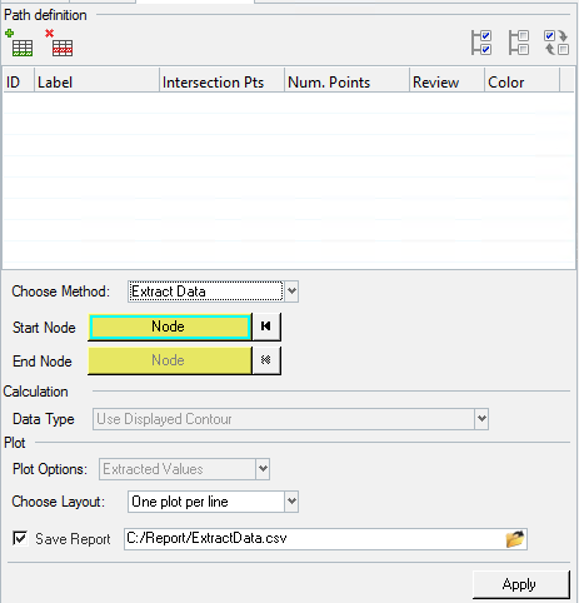
Figure 3.
The Extract-Linearize tool is displayed in the tab area and is broken down into three sections, each of which corresponds with the process order of using the tool.
Path definition
Allows you to create and manage the line definitions. Paths can be created by adding lines and picking start and end nodes. In addition, you can specify the method for which these paths are being defined. The following topic focuses only on the extract data method option.Path properties such as the number of points and color can also be set once the path is defined. There is also an Intersection points column. If this option is checked HyperView, will automatically generate points at the intersection of the path with the edge or face of the elements. A Review option is available to view the path in the modeling window.
Calculation
This is grayed out and displays 'Use Displayed Contour' to indicate that extract data only works on the displayed contour.Plot
Plot options shows 'Extracted values' and is grayed out to indicate that it will extract contour values. The layout of the plot windows can also be set. In addition, an option is available to export the calculation as a report to a comma separated file (.csv).Comments
- Extract Data is supported only on solid elements and works on any contour data.
- Extraction is performed at the simulation step at which the Apply button is clicked. Therefore, even if the Path was defined in another step, when applied, the line is updated per the location of the start and end nodes at the current step.
- You can either define the number of points or use the Intersection option to let HyperView generate the points. Both options cannot be used together.
- You can use the same path for either extracting data or performing stress linearization but note that the calculation and plot options will differ. Also in case of extract data, the value is extracted in the contour resolved in system whereas for stress linearization, values are extracted in a local coordinate system defined by the line and linearization is done on these values. See Stress Linearization for additional details.
- Extractions cannot be performed if some points are not on the model or on solid
elements. A message dialog will display stating
"Please re-define lines 1 2 3 as
            some points lie outside the model or some points lie on non-3D elements"
and the line will have to be re-defined. - The values are extracted as per the contour setting in the contour resolved in system.
- There is no live link between the HyperGraph plot and the HyperView window from which it is generated.
- The report for each line is automatically appended to the .csv file.